
Upcoming Workshops and Trainings
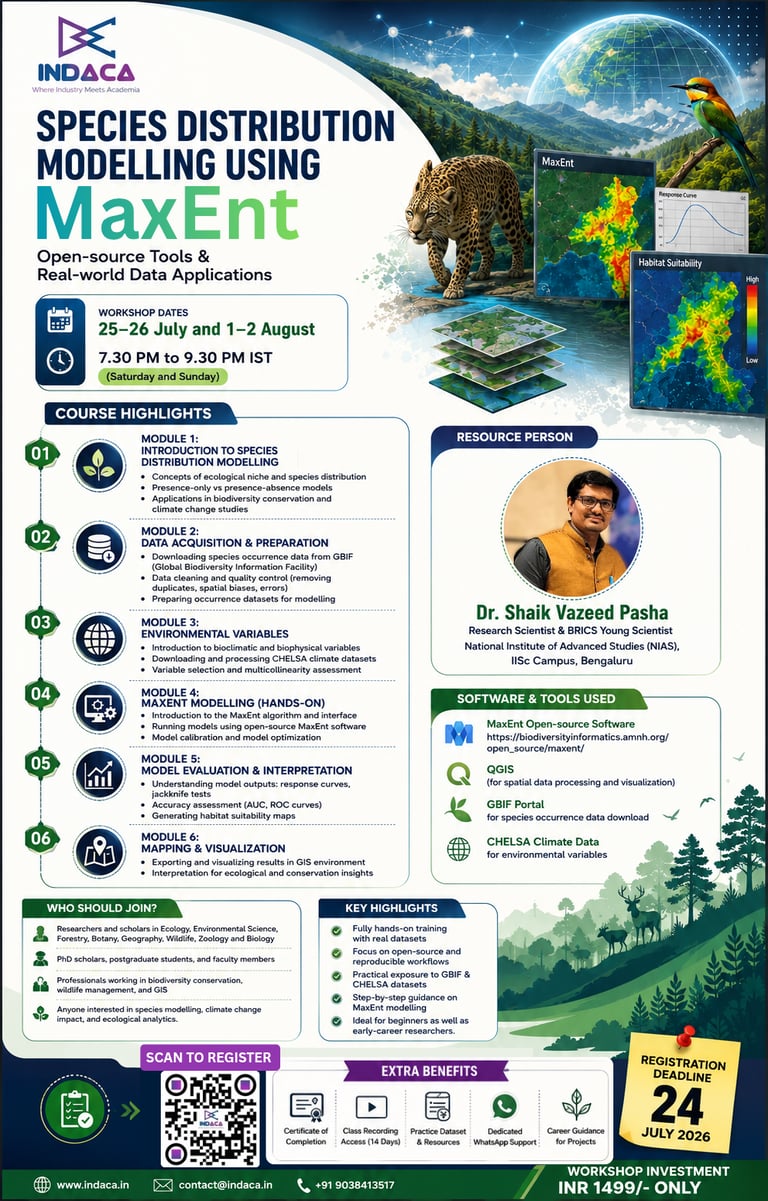
Join 4 day Workshop on Species Distribution Modelling using MaxEnt: Open-source Tools & Real-world Data Applications
Species Distribution Modelling (SDM) is a powerful approach used in ecology, conservation biology, and climate change research to predict the potential distribution of species across geographic landscapes. This intensive hands-on workshop will introduce participants to one of the most widely used machine-learning algorithms—MaxEnt (Maximum Entropy Model)—using open-source tools and global biodiversity datasets. Participants will gain practical experience in acquiring, processing, and analysing species occurrence data and environmental variables to generate predictive habitat suitability maps. The workshop emphasizes real-world datasets, reproducible workflows, and open-access platforms.
Dates: 25-26 July 2026 & 1-2 August 2026
Time: 7:30 PM - 9:30 PM (IST) | Saturday and Sunday
Mode: Online (via Zoom)
Instructor: Dr. SK Vazeed Pasha
Research Scientist | BRICS Young Scientist
National Institute of Advanced Studies (NIAS), IISc Campus, Bengaluru
Learning Outcome:
Independently perform Species Distribution Modelling using MaxEnt
Acquire and prepare biodiversity datasets from global repositories
Process environmental variables for ecological modelling
Build, calibrate, and evaluate MaxEnt models
Assess model performance using AUC, ROC curves, and Jackknife analysis
Generate professional-quality habitat suitability maps
Interpret ecological modelling outputs for biodiversity conservation and climate change studies
Apply Species Distribution Modelling techniques in research, dissertations, environmental consulting, and conservation planning
📊 Course Highlights:
Introduction to Species Distribution Modelling:
Fundamentals of Species Distribution Modelling (SDM) | Ecological niche concepts and species distribution | Presence-only vs. presence–absence modelling approaches | Applications in biodiversity conservation, habitat suitability analysis, invasive species assessment, and climate change research
Species Occurrence Data Acquisition & Preparation:
Downloading species occurrence records from GBIF (Global Biodiversity Information Facility) | Data quality assessment and cleaning | Removing duplicates, spatial biases, and erroneous records | Preparing occurrence datasets for modelling
Environmental Variables for SDM:
Introduction to bioclimatic and environmental variables | Downloading and processing CHELSA climate datasets | Understanding environmental predictors | Variable selection and multicollinearity assessment
MaxEnt Species Distribution Modelling:
Introduction to the MaxEnt algorithm | Understanding the MaxEnt interface | Running Species Distribution Models | Model calibration and parameter optimization | Developing reproducible modelling workflows
Model Evaluation & Ecological Interpretation:
Understanding MaxEnt outputs | Response curves and Jackknife analysis | Accuracy assessment using AUC and ROC curves | Model validation and interpretation | Understanding variable importance
Habitat Suitability Mapping & GIS Visualization:
Exporting MaxEnt outputs | Visualizing habitat suitability maps in QGIS | Spatial interpretation of model results | Applications for biodiversity conservation and ecological decision-making
Mark your calendars for 25-26 July 2026 & 1-2 August 2026, as the program kicks off with weekend sessions held on Saturdays and Sundays, totaling 8-10 hours of live classes and projects. Join us online via Zoom Meet from 19:30 HRS to 21:30 HRS (IST) and unlock your potential in the world of carbon accounting.
🎓 Who can join?
PhD Scholars of Ecology, Environmental Science, Forestry, Wildlife Science, Zoology, Botany, Geography, Biology, and Climate Science
Postgraduate Students of allied discipline
Faculty Members of allied discipline
Researchers in Ecology, Environmental Science, Forestry, Wildlife Science, Zoology, Botany, Geography, Biology, and Climate Science
GIS and Remote Sensing professionals interested in ecological applications
Biodiversity conservation practitioners
Environmental consultants
Wildlife managers
Anyone interested in species distribution modelling, habitat suitability analysis, and ecological research
Benefits of Choosing INDACA:
Recognized Certification: Validate your expertise in Species Distribution Modelling with a certification.
Session Recordings Access: Revisit workshop sessions for 1 year post-training.
Post-Workshop Support: Receive 3 months of dedicated support for your queries and project assistance.
Affordable Registration Fee: INR 1499/- (or USD 20/-) ensures accessible education for all.
Enrollment is now open, with registration closing on 24 August, 2026. Secure your spot today and take the first step towards becoming a data analytics expert. For inquiries and enrollment, call or WhatsApp us at +91 9038413517
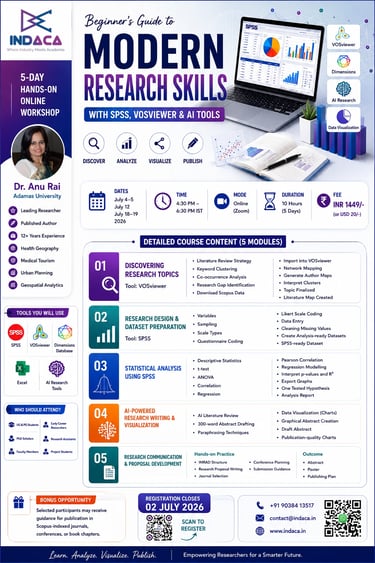
Beginner’s Guide to Modern Research Skills: A 5-Day Hands-On Workshop with SPSS, VOSviewer & AI Tools
Are you a student or early-career researcher unsure how to start your research journey?
This 5-day hands-on workshop is designed to give you a clear, confident start — from choosing the right research topic to analyzing real data and creating publication-ready content.
You'll learn how to identify research gaps using VOSviewer, perform statistical analysis in SPSS, and use AI-powered tools to enhance your writing and productivity.
By the end, you’ll walk away with a draft abstract, a visually mapped research idea, a working dataset, and the skills needed to move forward with your thesis, dissertation, or publication.
Perfect for anyone ready to turn ideas into real research outputs — step by step.
Course Details:
Dates: Jul 4-5 & July 12 & 18-19, 2026 (Weekends)
Time: 4:30 PM – 6:30 PM IST
Duration: 10 hours (2 hours/day × 5 days)
Mode: Live Online (via Zoom)
Certificate: E-Certificate of Participation
Instructor: Dr. Anu Rai, Adamas University, is a leading researcher and published author with monographs, edited volumes, and 25+ SCIE/Scopus/UGC-indexed publications to her name. She brings cutting-edge expertise in health geography, medical tourism, urban planning, and geospatial analytics—bridging academic excellence with real-world impact.
What You'll Learn:
How to identify relevant research gaps using VOSviewer (Bibliometric Analysis)?
How to frame research questions based on trends and academic needs?
How to analyze real data using SPSS – including t-tests, ANOVA, and regression?
How to use AI tools for literature review and academic writing?
How to visualize research data and trends for papers, posters, and presentations?
How to write a research abstract and prepare a poster/paper structure?
Course Highlights:
Discovering a Research Topic Using Bibliometric Tools
Tool Used: VOSviewer
Learn to structure your literature review, identify keyword clusters, and detect research gaps using bibliometric mapping. Hands-on practice includes importing data from Scopus/Dimensions, generating co-occurrence maps, and interpreting visual clusters.
Outcome: Finalized topic with a visual literature map.
Research Design & Dataset Preparation
Tool Used: SPSS
Understand core research design principles including variables, sampling, and scales. Practice structuring questionnaires, coding variables, and preparing clean datasets ready for analysis.
Outcome: SPSS-ready dataset.
Performing Statistical Analysis Using SPSS
Tool Used: SPSS
Get hands-on with descriptive and inferential statistics including t-tests, ANOVA, correlation, and regression. Learn to interpret p-values, coefficients, and R², and export results for reports.
Outcome: Tested hypothesis with an analysis report.
Writing & Visualizing Research Using AI Tools
Tools Used: Free & partially free AI writing tools
Explore ethical and effective use of AI in research writing. Draft abstracts, paraphrase content, and visualize data using charts and graphical abstracts.
Outcome: Draft abstract + visual charts for poster.
Research Communication & Proposal Development
Tools Used: MS Office, PowerPoint, Canva
Learn to structure abstracts (IMRAD), build proposals, and plan journal/conference submissions. Use templates and design tools to finalize your research outputs.
Outcome: Final abstract, research poster, and publishing plan.
Tools and Technologies
VosViewer
Dimension Database
Ms. Office and Excel
SPSS
AI Assistant Tools for Writing, Drafting and Designing
Who Should Attend?
Undergraduate & Postgraduate Students
MPhil / PhD Scholars
Dissertation/Project Students
Early Career Researchers
Faculty Members guiding research
Professionals starting academic writing
No prior experience needed. Beginners are welcome!
Why Choose This Course?
Recognized Certification: Validate your expertise in with a certification.
Session Recordings Access: Revisit workshop sessions for 1 year post-training.
Post-Workshop Support: Receive 3 months of dedicated support for your queries and project assistance.
Affordable Registration Fee: INR 1449/- (or USD 20/-) ensures accessible education for all.
🎁 Bonus Opportunity
Selected participants will be supported in publishing with Scopus-indexed journals, conferences, or as a Book Chapter.
For Inquiries (Call/WhatsApp): +91 9038413517
Email: contact@indaca.in
Registration Closes: July 2, 2025
Limited Seats Available!
Don’t miss this opportunity to upskill in modern research methods with expert-led, hands-on training!

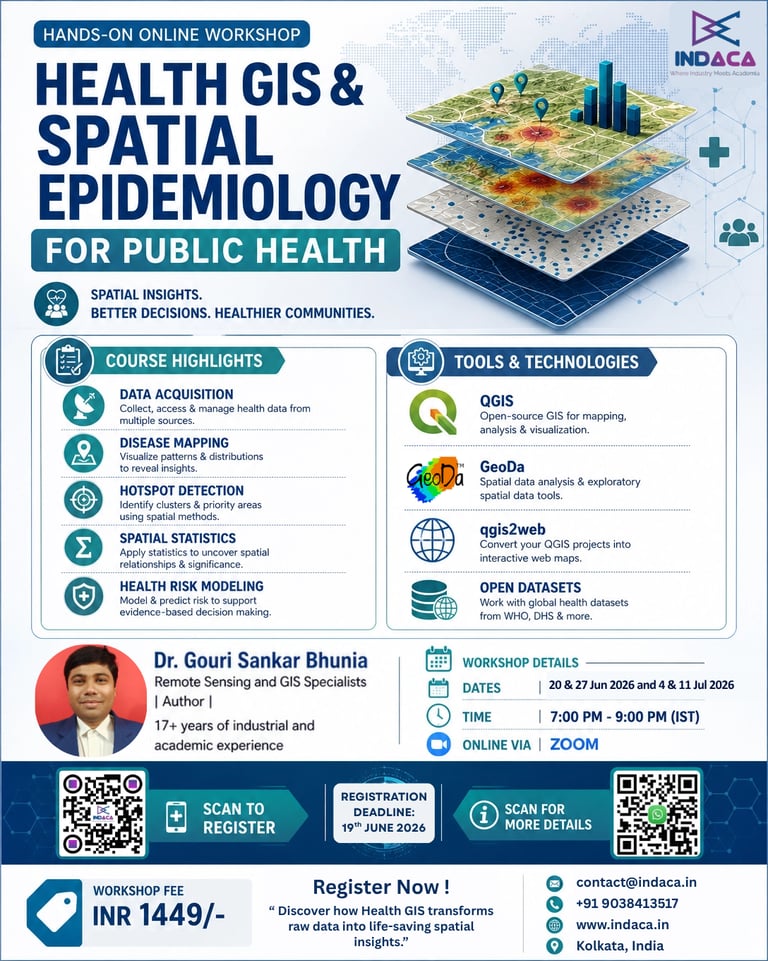
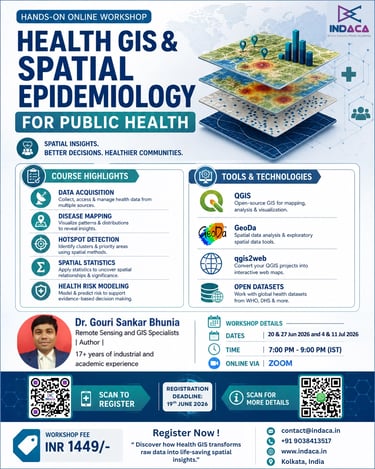
Join 4 day Workshop on Health GIS & Spatial Epidemiology for Public Health
Health outcomes are influenced by where people live, work, and access healthcare services. Health GIS enables researchers and practitioners to analyze disease patterns, healthcare accessibility, environmental health risks, and population vulnerabilities through spatial analysis. This hands-on workshop introduces participants to Health GIS and Spatial Epidemiology using open-source tools and real-world datasets. Participants will learn how to map health indicators, assess healthcare accessibility, identify disease hotspots, perform spatial statistical analyses, and create decision-support maps for research and policy applications.
Dates: 20 & 27 Jun 2026 and 4 & 11 Jul 2026
Time: 7:00 PM - 9:00 PM (IST) | Saturday and Sunday
Mode: Online (via Zoom)
Instructor: Dr. Gouri Sankar Bhunia, Remote Sensing and GIS Specialists | Author | 17+ years of industrial and academic experience
Location: Online (Zoom)
🚀 What You'll Gain:
Learn Health GIS and Spatial Epidemiology using industry-relevant open-source tools
Gain hands-on experience in Disease Mapping, Healthcare Accessibility Analysis, and Health Risk Assessment
Develop skills in QGIS, GeoDa, and Web GIS for health research and decision-making
Create publication-ready maps and visualizations for research, reports, and presentations
Work with real-world health, population, and environmental datasets
Complete a mini project for your portfolio
Certificate of Participation from the prestigious Indaca Institute of Skills.
Networking opportunities with industry experts and fellow participants.
Access to workshop resources for continued learning.
🌟 Course Highlights:
Introduction to Health GIS & Spatial Data Preparation: Understanding Health GIS | Applications in Public Health Research | Healthcare Planning and Disease Surveillance | Health Equity and Spatial Thinking
Data Acquisition & Preparation: Installing and Setting Up QGIS | Sources of Open Health Datasets | WHO, DHS, Census and OpenStreetMap Data | Importing, Cleaning and Managing Health Data | Practical Exercise: Mapping Healthcare Facilities | Disease Cases and Administrative Boundaries
Healthcare Accessibility & Service Coverage Analysis: Understanding Healthcare Access - Measuring Accessibility to Healthcare Services | Healthcare Catchment Areas | Identifying Underserved Populations
Spatial Analysis Techniques: Buffer Analysis | Proximity Analysis | Population Coverage Assessment | Network vs Euclidean Distance | Practical Exercise - Develop a healthcare accessibility map for a selected region.
Disease Mapping & Spatial Epidemiology: Disease Pattern Analysis - Thematic Mapping of Health Indicators | Disease Distribution Mapping | Disease Hotspot Identification
Spatial Statistics Using GeoDa: Kernel Density Estimation | Moran's I | Local Moran's I (LISA) | Spatial Autocorrelation | Practical Exercise: Detect and interpret disease clusters using real-world datasets.
Health Risk Modeling & Decision Support: Health Risk Assessment - Environmental and Socioeconomic Determinants of Health | Population Vulnerability Mapping | Multi-Criteria Health Risk Analysis
Communicating Results - Interactive Web Mapping with qgis2web | Publication-Ready Maps | GIS Outputs for Research and Policy
Capstone Project: Create a Health Risk and Accessibility Assessment Map integrating: Disease Data | Healthcare Infrastructure | Population Characteristics | Environmental Risk Factors
🌟 Program Benefits:
Certificate of Participation from the prestigious Indaca Institute of Skills.
Networking opportunities with industry experts and peers.
Access to workshop materials and resources for continued learning.
Enhanced skills and knowledge to boost your career in remote sensing and agriculture.
🌟 Who Should Enroll:
Researchers and professionals in Public Health, Epidemiology, Health Sciences, Environmental Health, and Medical Geography
Faculty Members, PhD Scholars, Postdoctoral Researchers, and Postgraduate Students seeking to integrate spatial analysis into their research
Professionals working in Healthcare Management, Health Policy, Disease Surveillance, and Community Health Programs
Practitioners from NGOs, Government Departments, International Organizations, and the Development Sector involved in health, population, and social welfare initiatives
Researchers in Environmental Sciences, Climate Change, Urban Studies, Sociology, Demography, and Development Studies
GIS Analysts, Data Analysts, Urban and Regional Planners interested in health, infrastructure, accessibility, and vulnerability assessment
Students and early-career professionals looking to build skills in Health GIS, Spatial Epidemiology, and Health Risk Mapping
Anyone interested in leveraging location intelligence and spatial data to address public health challenges and support evidence-based decision-making
💰 Benefits of Choosing INDACA:
Certificate of Completion: Receive a recognized certificate upon completing the workshop, validating your proficiency in Health GIS.
Session Recordings Access: Enjoy 1 year access to recorded sessions, allowing you to revisit key concepts and reinforce your learning at your own pace.
3-Month Post-Workshop Support: Receive dedicated support for three months post-workshop, ensuring continuous learning and guidance as you apply your skills.
Affordable Registration Fees: INDACA believes in accessible education. Register for the workshop at a nominal fee of INR 1449/- or USD 20/-
📞 For Inquiries (Call): +91 7439308037
(WhatsApp): +91 9038413517
Don't miss this opportunity to revolutionize your Health GIS ! Register Now!
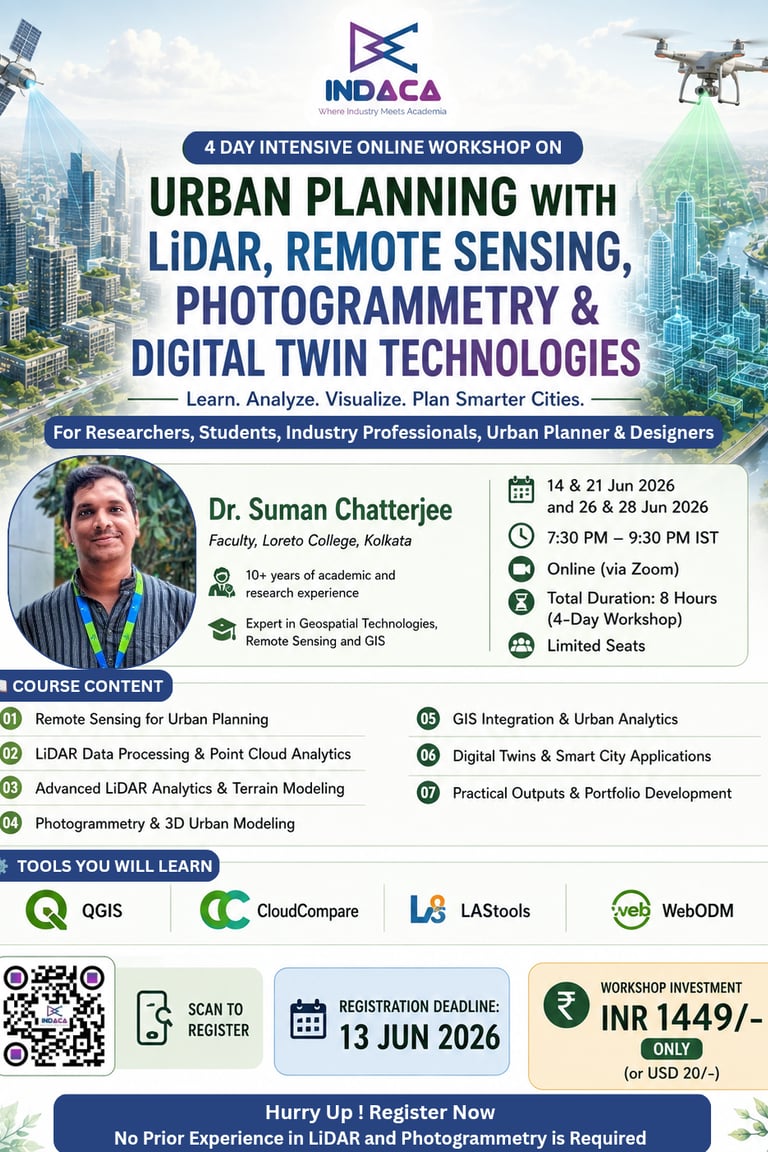
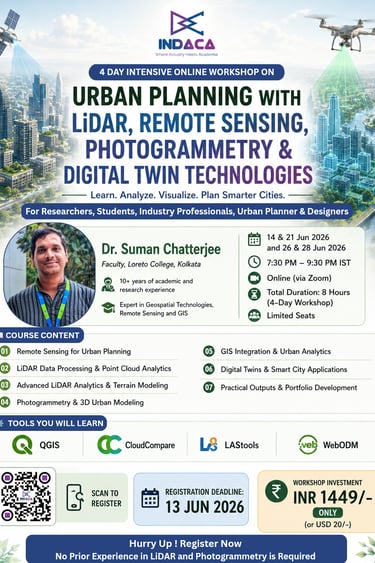
Join 4 day Workshop on Urban Planning with LiDAR, Remote Sensing, Photogrammetry & Digital Twin Technologies
Learn the technologies powering Smart Cities and Digital Twins. From satellite imagery and LiDAR point clouds to 3D urban models, gain hands-on experience with real-world datasets and open-source software. Limited seats – Register before 13 June 2026.
Dates: 14 & 21 June, 26 & 28 June 2026
Time: 7:30 PM - 9:30 PM (IST) | Weekends
Mode: Online (via Zoom)
Instructor: Dr. Suman Chatterjee, Loreto College, Kolkata, Faculty, Loreto College, Kolkata
What You'll Gain:
Understand how Remote Sensing, LiDAR, Photogrammetry, and GIS are transforming modern urban planning and smart city development
Analyze satellite imagery to monitor urban growth, environmental conditions, and land use changes
Compute and interpret key urban indicators such as NDVI, NDBI, and NDWI for planning and decision-making
Process and classify LiDAR point clouds for urban infrastructure, terrain, and vegetation analysis
Generate industry-standard products including DEMs, DSMs, and Canopy Height Models (CHMs)
Extract building heights, terrain characteristics, and urban features from LiDAR datasets
Create orthomosaics and realistic 3D city models using photogrammetry workflows
Perform spatial measurements including length, area, height, and volume estimation
Integrate Remote Sensing, LiDAR, Photogrammetry, and GIS data within a unified geospatial workflow
Explore Digital Twin concepts and their applications in Smart Cities, infrastructure management, and urban analytics
Gain hands-on experience with open-source tools including QGIS, CloudCompare, LAStools, and WebODM
Build portfolio-ready outputs and practical skills relevant to research, higher education, consulting, and industry projects
Receive access to workshop recordings, datasets, and learning resources for continued practice
Strengthen your profile for careers and research in Urban Planning, GIS, Remote Sensing, Smart Cities, Civil Engineering, Architecture, and Environmental Management
📊 Course Highlights:
Remote Sensing - Foundations for Urban Planning: Role of Remote Sensing in Urban Planning | Urban Growth and Land Use Dynamics | Multispectral Satellite Data (Sentinel-2 & Landsat) | Urban Environmental Monitoring | Remote Sensing Indices for Urban Analysis | Hands-on (Using QGIS): Satellite data visualization | NDVI for urban vegetation assessment | NDBI for built-up area mapping | NDWI for water body assessment | Basic urban land cover classification
LiDAR Data Processing & Point Cloud Analytics: Introduction to LiDAR Technology | Airborne vs Terrestrial LiDAR | LiDAR Data Structure | Point Cloud Fundamentals | Applications in Urban Planning | Building Height and Infrastructure Mapping | Hands-on (Using LAStools, CloudCompare & QGIS): Importing LAS/LAZ datasets | Point cloud visualization | Noise filtering | Ground and non-ground classification | Point cloud statistics | Building and vegetation extraction
Advanced LiDAR Analytics & Terrain Modeling: DEM, DSM and CHM Concepts | Surface Modeling Techniques | Urban Morphology Analysis | LiDAR for Infrastructure Assessment | Urban Forestry and Green Space Analytics | Hands-on (Using LAStools, CloudCompare & QGIS) | Generate DEM | Generate DSM | Generate CHM | Building height extraction | Tree canopy analysis | Elevation and slope mapping | Cross-section profiling
Photogrammetry & 3D Urban Modeling: Photogrammetry for Urban Planning | Orthomosaic Generation | Structure-from-Motion (SfM) | Digital Twins and Smart Cities | Integrating LiDAR and Photogrammetry | Hands-on (Using WebODM, CloudCompare & QGIS): Orthomosaic generation | DSM creation | 3D model generation | Length, area and volume measurement | Stockpile and excavation volume estimation | Integration with GIS layers
Mark your calendars for 14 & 21 June, 26 & 28 June 2026, as the program kicks off with weekend sessions held on Saturdays and Sundays, totaling 8-10 hours of live classes and projects. Join us online via Zoom Meet from 19:30 HRS to 21:30 HRS (IST) and unlock your potential in the world of carbon accounting.
🎓 Who can join?
Students & Scholars – Undergraduate, Postgraduate, PhD scholars, and researchers in Urban Planning, Geography, GIS, Remote Sensing, Architecture, Civil Engineering, Environmental Science, and related fields.
Urban Planning & Government Professionals – Urban planners, municipal officials, smart city professionals, and development authority personnel.
Industry Professionals – GIS analysts, remote sensing specialists, surveyors, infrastructure consultants, environmental consultants, and geospatial professionals.
Researchers & Academics – Individuals working in urban studies, smart cities, environmental monitoring, infrastructure planning, and spatial analytics.
Technology Enthusiasts – Anyone interested in LiDAR, Digital Twins, 3D city modeling, urban analytics, and emerging geospatial technologies.
Benefits of Choosing INDACA:
Recognized Certification: Validate your expertise in Urban Planning with LiDAR, Remote Sensing, Photogrammetry & Digital Twin Technologies with a certification.
Session Recordings Access: Revisit workshop sessions for 1 year post-training.
Post-Workshop Support: Receive 3 months of dedicated support for your queries and project assistance.
Affordable Registration Fee: INR 1449/- (or USD 20/-) ensures accessible education for all.
Enrollment is now open, with registration closing on 13 Jun, 2026. Secure your spot today and take the first step towards becoming a data analytics expert. For inquiries and enrollment, call or WhatsApp us at +91 9038413517
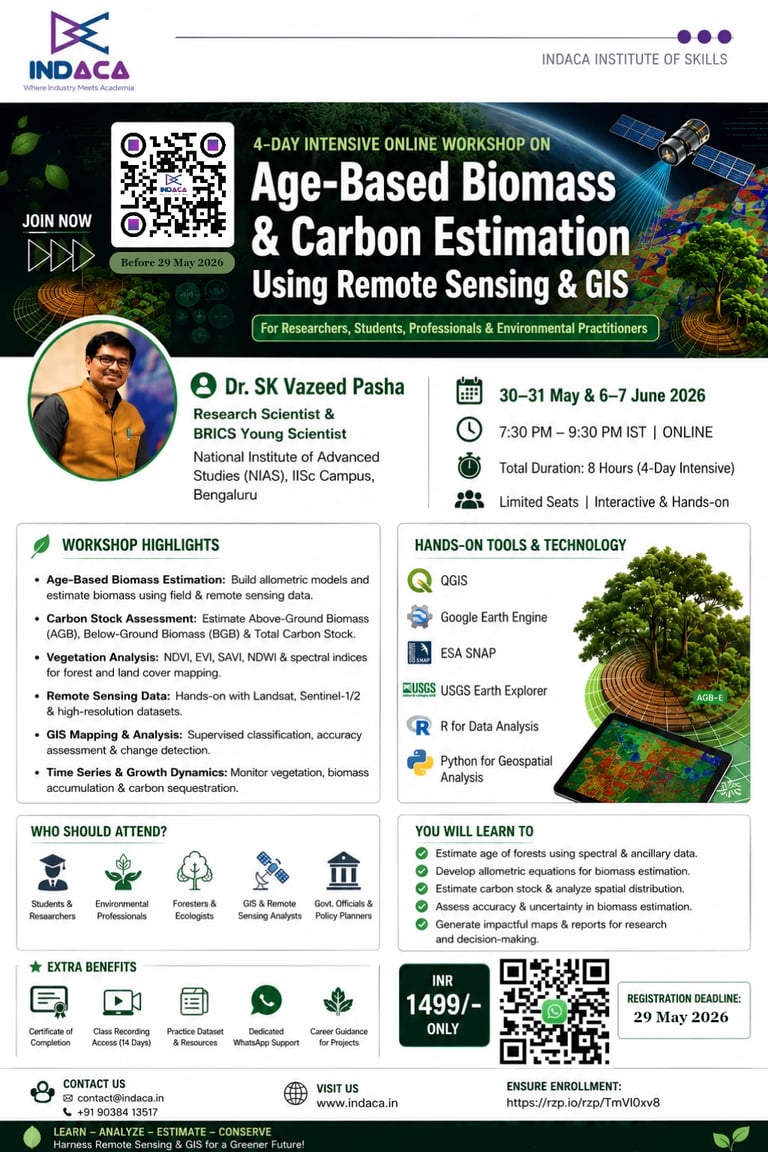
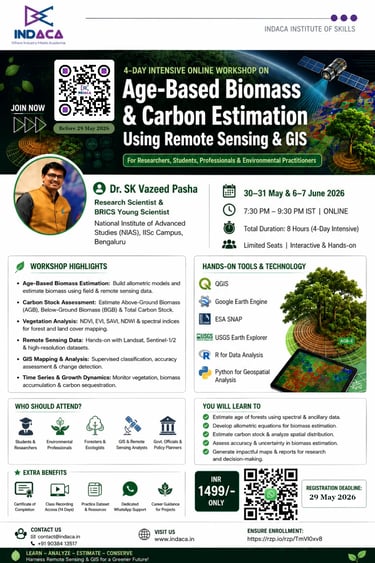
Join 4 day Workshop on Age-Based Biomass & Carbon Estimation Using Remote Sensing & GIS
This workshop is a hands-on, research-oriented training program designed to introduce participants to advanced biomass and carbon stock estimation using Remote Sensing and GIS. Through practical workflows and real-world satellite datasets, participants will learn how to generate accurate biomass and carbon maps for forestry, climate, and environmental applications. The course covers multi-temporal satellite analysis, vegetation modelling, spatial analysis, and carbon estimation techniques using industry-relevant geospatial tools and global biomass datasets.
Dates: May 30-31 & Jun 6-7, 2026
Time: 7:30 PM - 9:30 PM (IST) | Saturday and Sunday
Mode: Online (via Zoom)
Instructor: Dr. SK Vazeed Pasha
Research Scientist | BRICS Young Scientist
National Institute of Advanced Studies (NIAS), IISc Campus, Bengaluru
What You'll Gain:
Generate scientifically reliable biomass and carbon stock maps using multi-source satellite datasets
Perform time-series analysis for environmental and land-cover change monitoring
Apply NDVI and spectral indices for vegetation health and growth assessment
Conduct digital image classification for accurate land use and land cover (LULC) mapping
Use age-class segmentation techniques for improved biomass estimation accuracy
Apply age-based and allometric modelling approaches in biomass and carbon estimation
Work with global biomass datasets such as NASA GEDI, ESA BIOMASS, GlobBiomass, and Copernicus Forest Biomass
Independently carry out complete geospatial workflows for forestry, climate, biodiversity, and ecological applications
Develop practical skills relevant to forestry, agroforestry, biodiversity conservation, and climate change research
Complete a mini project for your portfolio
Certificate of Participation from the prestigious Indaca Institute of Skills.
Networking opportunities with industry experts and fellow participants.
Access to workshop resources for continued learning.
📊 Course Highlights:
Foundations of Remote Sensing & GIS: Build a strong foundation in remote sensing and GIS for real-world environmental applications | Understand LULC, topographic maps, and multi-source datasets | Hands-on: explore spatial data and GIS tools
Vegetation Analysis & Indices: Analyze vegetation dynamics using phenology and spectral indices | Apply NDVI and related indices to assess vegetation health and growth | Hands-on: multi-temporal vegetation analysis
Satellite Data Processing & Change Detection: Acquire and preprocess Landsat and Sentinel data | Perform supervised classification and generate accurate LULC maps | Detect land-use changes over time using multi-temporal analysis | Hands-on: complete preprocessing → classification → change detection workflow.
Age-Class Mapping & Time-Series Analysis: Derive plantation age using NDVI time-series data | Segment vegetation into meaningful age classes | Map growth stages using spectral behaviour | Hands-on: time-series analysis → Geodatabase coding → age-class mapping.
Biomass & Carbon Estimation (Applied Workflow): Estimate Above-Ground Biomass (AGB) using age-based and allometric models | Integrate global datasets (NASA GEDI, ESA BIOMASS, GlobBiomass, Copernicus Forest Biomass) | Convert biomass to carbon stock using IPCC guidelines | Hands-on: biomass modelling → carbon conversion → carbon map generation.
Spatial Modelling, Validation & Outputs: Generate landscape-level carbon maps | Apply spatial interpolation and zonal statistics | Assess accuracy and uncertainty for reliable outputs | Hands-on: complete end-to-end workflow → validation → map visualization and reporting.
Mark your calendars for May 30-31 & Jun 6-7, 2026, as the program kicks off with weekend sessions held on Saturdays and Sundays, totaling 8-10 hours of live classes and projects. Join us online via Zoom Meet from 19:30 HRS to 21:30 HRS (IST) and unlock your potential in the world of carbon accounting.
🎓 Who can join?
Students and research scholars
GIS and Remote Sensing professionals
Forestry and environmental science professionals
Climate and ecological researchers
Academicians and government professionals
Individuals seeking practical and industry-relevant expertise in biomass and carbon estimation workflows
Benefits of Choosing INDACA:
Recognized Certification: Validate your expertise in Biomass & Carbon Estimation with a certification.
Session Recordings Access: Revisit workshop sessions for 1 year post-training.
Post-Workshop Support: Receive 3 months of dedicated support for your queries and project assistance.
Affordable Registration Fee: INR 1499/- (or USD 20/-) ensures accessible education for all.
Enrollment is now open, with registration closing on 29 May, 2026. Secure your spot today and take the first step towards becoming a data analytics expert. For inquiries and enrollment, call or WhatsApp us at +91 9038413517
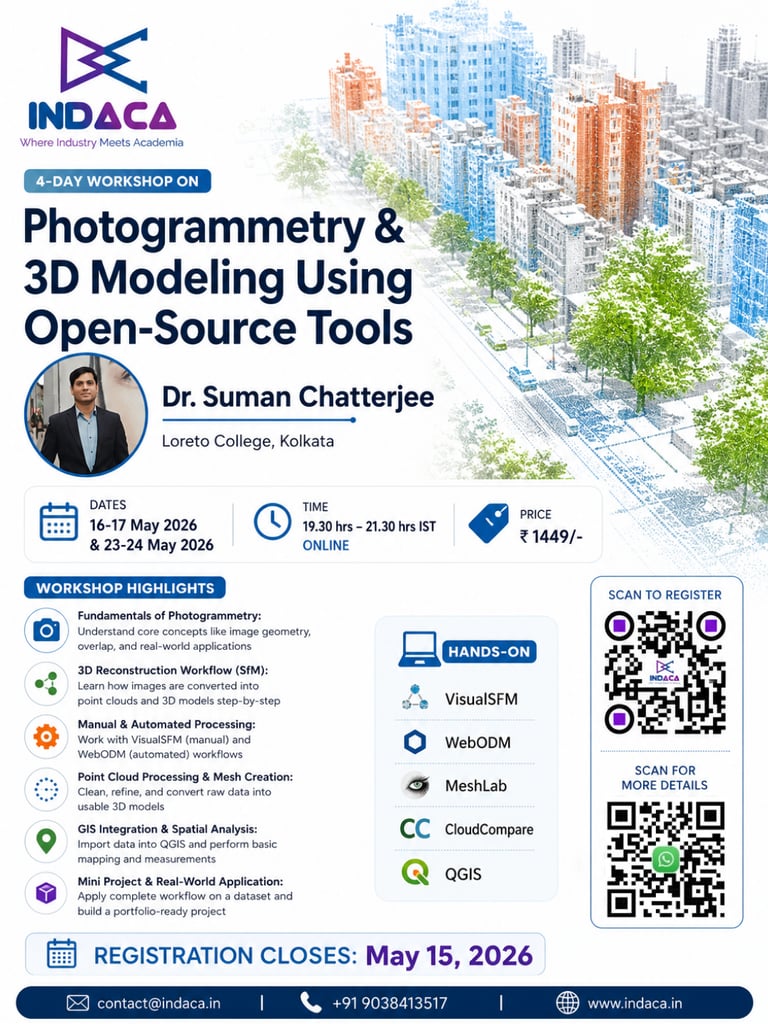
Join 4 day Workshop on Photogrammetry & 3D Modeling Using Open-Source Tools
Turn images into powerful 3D models and spatial data in just 4 days. This hands-on workshop is designed to help you learn photogrammetry from scratch to an intermediate level, using 100% open-source tools. Whether you're from architecture, GIS, planning, or engineering—this workshop will equip you with practical skills to create, analyze, and extract real-world insights from images.
Dates: May 16-17 & May 23-24, 2026
Time: 7:30 PM - 9:30 PM (IST) | Saturday and Sunday
Mode: Online (via Zoom)
Instructor: Dr. Suman Chatterjee, Faculty, Loreto College, Kolkata
What You'll Gain:
Build your own 3D model from images
Learn complete photogrammetry workflow (start to finish)
Work with point clouds, meshes & orthophotos
Perform basic GIS integration and spatial analysis
Gain hands-on experience with industry-relevant open-source tools
Complete a mini project for your portfolio
Certificate of Participation from the prestigious Indaca Institute of Skills.
Networking opportunities with industry experts and fellow participants.
Access to workshop resources for continued learning.
📊 Course Highlights:
Foundations of Photogrammetry: What is Photogrammetry? Applications across domains | Types: Aerial vs Terrestrial | Key principles: overlap, tie points, camera geometry | Understanding datasets (drone/mobile images) | Accuracy & limitations | Create your own Sparse Point Cloud (Initial 3D Model) | Hands-on: Exploring sample dataset and Installing and navigating: VisualSFM and MeshLab, Dataset quality check, Introduction to SfM workflow
Reconstruction – Manual vs Automated Workflow: Structure-from-Motion (SfM) workflow | Feature detection & matching | Sparse vs dense point clouds | Manual vs automated photogrammetry pipelines | Hands-on - Manual Workflow Using VisualSFM: Feature extraction & matching | Sparse reconstruction | Dense reconstruction | Export point cloud (PLY) and Automated Workflow (Industry-Oriented) Using WebODM: Upload dataset | Run processing (default settings) | Monitor job progress | Explore outputs: Orthophoto | Dense point cloud | DSM/DTM | Textured 3D model | Create your own Sparse point cloud (VisualSFM); Dense point cloud (VisualSFM & WebODM); Orthophoto & DSM (WebODM); 3D model (WebODM)
Processing, Cleaning and GIS Integration: Mesh generation and texturing | Point cloud noise and filtering | Scaling and measurements | Introduction to georeferencing | GIS integration concepts | Extracting distance, area, elevation | Accuracy considerations | Hands-on Import outputs (from VisualSFM/WebODM) into: CloudCompare → cleaning, filtering, measurement MeshLab → mesh generation & refinement | Generate mesh | Perform scaling and measurements | Import into QGIS | Overlay orthophoto / spatial layers | Create your own Cleaned point cloud | Mesh mode | GIS-ready dataset | Spatial visualization
Mini Project & Real-World Application: Real-world applications (urban mapping, site analysis)| Feature extraction (buildings, roads) | Accuracy and interpretation | Comparison: VisualSFM vs WebODM vs modern tools | Hands-on (Mini Project) | Manual Workflow - Process dataset using VisualSFM | Mesh creation in MeshLab and Automated Workflow - Process dataset using WebODM
Mark your calendars for May 16-17 & May 23-24, 2026, as the program kicks off with weekend sessions held on Saturdays and Sundays, totaling 8-10 hours of live classes and projects. Join us online via Zoom Meet from 19:30 HRS to 21:30 HRS (IST) and unlock your potential in the world of data analytics.
🎓 Who can join?
Researchers & Scientists: Specializing in remote sensing, geospatial analysis, environmental science, urban studies, and infrastructure monitoring who want to leverage photogrammetry for data-driven research and modeling.
Students & Academics: In Geography, GIS, Remote Sensing, Architecture, Urban Planning, Civil Engineering, Environmental Studies, and related fields looking to build practical, job-ready skills in 3D modeling and spatial analysis.
Industry Professionals: Working in surveying, construction, urban planning, smart city projects, mapping, infrastructure development, and consulting who want to integrate photogrammetry into real-world workflows.
Enthusiasts: Anyone passionate about 3D modeling, drone mapping, digital mapping, or spatial technologies, even with no prior experience, eager to learn through hands-on practice.
Benefits of Choosing INDACA:
Recognized Certification: Validate your expertise in photogrammetry with a certification.
Session Recordings Access: Revisit workshop sessions for 1 year post-training.
Post-Workshop Support: Receive 3 months of dedicated support for your queries and project assistance.
Affordable Registration Fee: INR 1449/- (or USD 20/-) ensures accessible education for all.
Enrollment is now open, with registration closing on 15 May, 2026. Secure your spot today and take the first step towards becoming a data analytics expert. For inquiries and enrollment, call or WhatsApp us at +91 9038413517

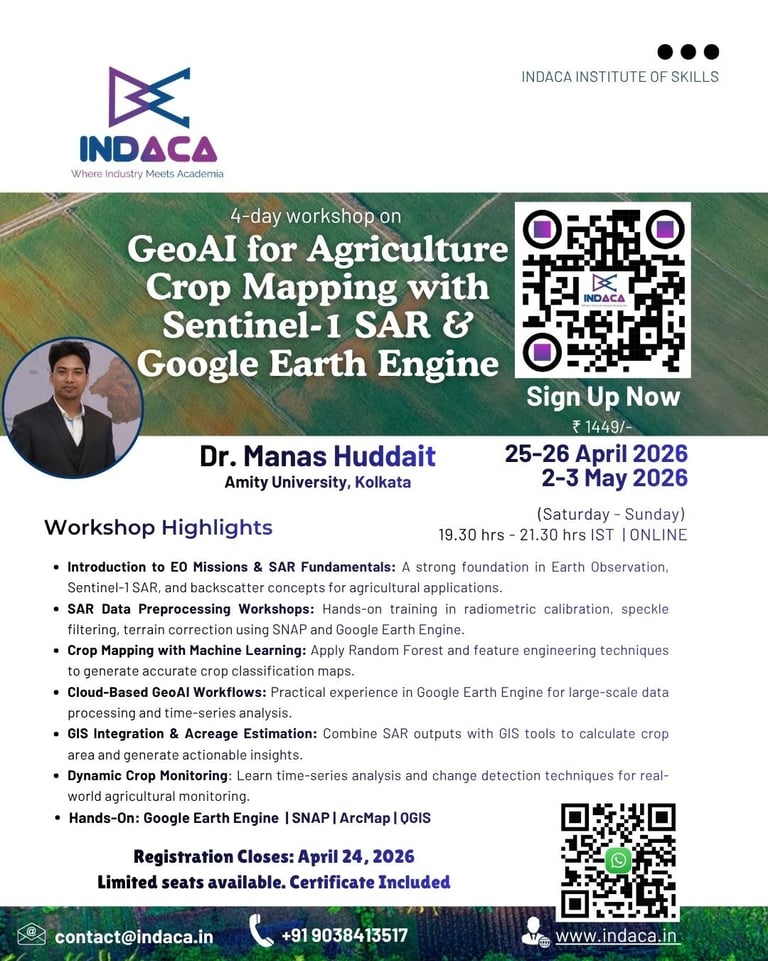
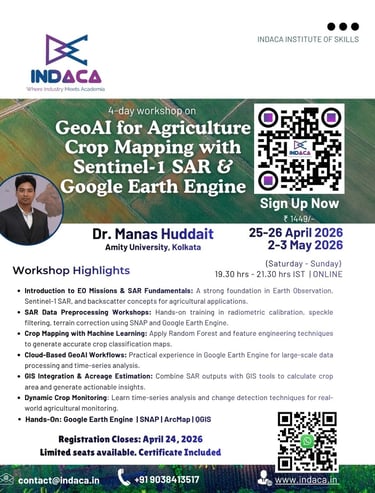
Join 4 day Workshop on GeoAI for Agriculture: Crop Mapping with Sentinel-1 SAR & Google Earth Engine
Join us for an immersive 4-day workshop hosted by the Indaca Institute of Skills, designed to help you harness the power of Synthetic Aperture Radar (SAR) for advanced agricultural applications. This hands-on workshop introduces you to the power of GeoAI in agriculture using Sentinel-1 SAR data and Google Earth Engine. Learn how to process satellite data, build machine learning models, and generate crop intelligence — even in cloud-covered regions.
📅 Date: 25-26 April, 2026 & 2-3 May, 2026
🕖 Time: 7:30 PM - 9:30 PM (IST)
🌐 Location: Online (Zoom)
🔗 Sign Up Now
🚀 What You'll Gain:
Practical experience with SAR-based remote sensing
Hands-on skills in Google Earth Engine & SNAP
Ability to build AI-driven crop classification models
Knowledge of acreage estimation & GIS integration
Exposure to real-world agriculture datasets and workflows
A complete project to showcase in your portfolio
🌟 Course Highlights:
Introduction to EO Missions & SAR Fundamentals: A strong foundation in Earth Observation, Sentinel-1 SAR, and backscatter concepts for agricultural applications.
SAR Data Preprocessing Workshops: Hands-on training in radiometric calibration, speckle filtering, terrain correction using SNAP and Google Earth Engine.
Crop Mapping with Machine Learning: Apply Random Forest and feature engineering techniques to generate accurate crop classification maps.
Cloud-Based GeoAI Workflows: Practical experience in Google Earth Engine for large-scale data processing and time-series analysis.
GIS Integration & Acreage Estimation: Combine SAR outputs with GIS tools to calculate crop area and generate actionable insights.
Dynamic Crop Monitoring: Learn time-series analysis and change detection techniques for real-world agricultural monitoring.
🌟 Program Benefits:
Certificate of Participation from the prestigious Indaca Institute of Skills.
Networking opportunities with industry experts and peers.
Access to workshop materials and resources for continued learning.
Enhanced skills and knowledge to boost your career in remote sensing and agriculture.
🌟 Who Should Enroll:
Agricultural researchers and scientists.
Students and academics in geography, agronomy, and environmental science.
Professionals in agriculture, forestry, and land management.
Anyone interested in exploring SAR technology and agriculture.
💰 Benefits of Choosing INDACA:
Certificate of Completion: Receive a recognized certificate upon completing the workshop, validating your proficiency in GeoAI in agriculture.
Session Recordings Access: Enjoy 1 year access to recorded sessions, allowing you to revisit key concepts and reinforce your learning at your own pace.
3-Month Post-Workshop Support: Receive dedicated support for three months post-workshop, ensuring continuous learning and guidance as you apply your skills.
Affordable Registration Fees: INDACA believes in accessible education. Register for the workshop at a nominal fee of INR 1449/- or USD 20/-
📞 For Inquiries (Call): +91 7439308037
(WhatsApp): +91 9038413517
Don't miss this opportunity to revolutionize your agricultural research! Register Now!
4 day online workshop on Geo-Informatics for Groundwater Dynamics: Hands-on Approaches to Depletion, Recovery, Drought Assessment, and Basin Management
Geo-Informatics for Groundwater Dynamics is a hands-on, industry-relevant training designed to help you understand how groundwater systems behave across time and space. In this 4-day live online course, you will learn how to analyze groundwater depletion, recovery patterns, drought dynamics, and basin-level water budgets using real-world datasets and practical tools. From geospatial fundamentals to advanced hydrological insights, this program bridges the gap between theory and application—empowering you with skills that are highly valuable in research, environmental consulting, and water resource management.
What You'll Gain:
Strong foundation in geo-informatics for water resource analysis
Hands-on skills in mapping groundwater depletion & recovery trends
Ability to perform multitemporal and spatial analysis using GIS tools
Practical understanding of groundwater drought assessment
Skills to analyze climate–land–water interactions
Experience in computing basin-scale water budgets
Exposure to real datasets and applied workflows used in research & industry
Apply skills directly to research publications, projects, and policy studies
Receive a Certificate of Participation from INDACA
📊 Course Highlights:
Unlocking Geo-Informatics Foundations: Fundamentals of geospatial technologies | Data acquisition methods for environmental and water resource applications | Practical exposure to GIS platforms
Tracing Groundwater Journeys Across Time: Multitemporal dataset analysis | Mapping groundwater depletion and recovery trends | Identifying spatial patterns of stress and resilience
Decoding Subsurface Drought Dynamics: Seasonal groundwater drought assessment | Impact of land use changes on groundwater systems | Climate–land–water interaction analysis
Computation of River Basin Water Budgets: Concepts of basin-scale hydrological analysis | Computational techniques for water budget estimation | Strategies for integrated and sustainable basin management
Mark your calendars for 11-12 April and 18-19 April, 2026, as the program kicks off with weekend sessions held on Saturdays and Sundays, totaling 8-10 hours of live classes and projects. Join us online via Zoom Meet from 19:00 HRS to 21:00 HRS (IST) and unlock your potential in the world of data analytics.
🎓 Who can join?
Students in Civil Engineering, Environmental Science, Geography, Geology
Researchers and PhD scholars working in water resources or climate studies
Professionals in GIS, remote sensing, and environmental consulting
Government/NGO professionals involved in water management & policy
Anyone looking to build practical skills in groundwater analytics
Benefits of Choosing INDACA:
Certificate of Completion: Receive a recognized certificate upon completing the workshop, validating your proficiency in geoinformatics for groundwater.
Session Recordings Access: Enjoy access to recorded sessions, allowing you to revisit key concepts and reinforce your learning at your own pace.
3-Month Post-Workshop Support: Receive dedicated support for three months post-workshop, ensuring continuous learning and guidance as you apply your skills.
Affordable Registration Fees: INDACA believes in accessible education. Register for the workshop at a nominal fee of INR 1449/- or USD 25/-.
Enrollment is now open, with registration closing on 10 April, 2026. Secure your spot today and take the first step towards becoming a data analytics expert. For inquiries and enrollment, call or WhatsApp us at +91 9038413517

Join 4 day online workshop on Bioinformatics for Beginners Using Open Source Tools
Bioinformatics has become a cornerstone of modern biological research, enabling scientists to analyze large-scale biological data and uncover meaningful insights using computational approaches. This practical workshop is designed to introduce participants to essential bioinformatics concepts while providing hands-on experience with widely used open-source tools and biological databases used in research and industry.
Throughout the sessions, participants will work with real biological datasets and learn how to explore biological databases such as NCBI, UniProt, and RCSB Protein Data Bank, perform protein structure modeling and visualization using SWISS-MODEL and PyMOL, and conduct molecular docking analysis using AutoDock Tools and AutoDock Vina. The workshop will also guide participants in analyzing gene expression data using GEO and GEO2R, building protein–protein interaction networks using STRING and Cytoscape, and exploring the applications of artificial intelligence and machine learning in bioinformatics using tools such as Weka and Python-based libraries like scikit-learn.
By combining conceptual understanding with guided practical demonstrations, this workshop will help participants build a strong foundation in bioinformatics workflows and gain confidence in using computational tools for biological data analysis.
What You'll Gain:
Practical exposure to real-world bioinformatics tools and databases
Hands-on experience with protein modeling, docking, and transcriptomics analysis
Understanding of biological network analysis and biomarker discovery methods
Introduction to machine learning techniques applied to biomedical datasets
Confidence to begin bioinformatics research using open-source tools
Certificate of participation from INDACA Institute of Skills
📊 Course Highlights:
Sequence Analysis & Biological Databases
Introduction to bioinformatics workflows in research & industry
DNA, RNA & protein sequence fundamentals
Sequence similarity, alignment & annotation concepts
Biological databases: structure, usage & real-world applications
Introduction to BLAST & sequence homology
Hands-On: NCBI (GenBank, BLAST); UniProt (protein knowledgebase); EMBL-EBI tools; Expasy; MEGA
Protein Modeling & Molecular Docking
Protein structure basics (primary to quaternary)
Homology modeling concepts
Protein structure validation
Protein–ligand interaction principles
Binding affinity, docking & scoring functions
Applications in drug discovery & design
Hands-On: SWISS-MODEL ; PyMOL (visualization) ; RCSB Protein Data Bank (PDB); AutoDock Tools ; AutoDock Vina
Genomics, NGS & Transcriptomics
Introduction to genomics & Next-Generation Sequencing (NGS)
Types of sequencing (WGS, RNA-Seq)
Gene expression analysis basics
Functional annotation & pathway analysis
Biomarker discovery concepts
Hands-On: NCBI SRA (Sequence Read Archive) ; Galaxy Platform (beginner-friendly NGS analysis); GEO & GEO2R; DAVID / Enrichr (functional enrichment); STRING (interaction networks)
Machine Learning & AI in Bioinformatics
Introduction to AI & ML in life sciences
Supervised vs unsupervised learning
Classification models in biomedical research
Model evaluation metrics (accuracy, precision, ROC)
AI applications in genomics, drug discovery & precision medicine
Hands-On: Python (Google Colab); scikit-learn ; Weka (no-code ML option); Deep Learning tools (conceptual)
Mark your calendars for 28–29 March and 4-5 April, 2026, as the program kicks off with weekend sessions held on Saturdays and Sundays, totaling 8-10 hours of live classes and projects. Join us online via Zoom Meet from 19:00 HRS to 21:00 HRS (IST) and unlock your potential in the world of data analytics.
🎓 Who can join?
Postgraduate students in Life Sciences, Biotechnology,
Bioinformatics, and related fields
Research scholars and PhD candidates
Faculty members interested in computational biology tools
Early-career professionals exploring bioinformatics applications
Anyone interested in integrating biology with data science and computational
Benefits of Choosing INDACA:
Certificate of Completion: Receive a recognized certificate upon completing the workshop, validating your proficiency in bioinformatics.
Session Recordings Access: Enjoy access to recorded sessions, allowing you to revisit key concepts and reinforce your learning at your own pace.
3-Month Post-Workshop Support: Receive dedicated support for three months post-workshop, ensuring continuous learning and guidance as you apply your skills.
Affordable Registration Fees: INDACA believes in accessible education. Register for the workshop at a nominal fee of INR 1449/- or USD 25/-.
Enrollment is now open, with registration closing on 26 March, 2026. Secure your spot today and take the first step towards becoming a data analytics expert. For inquiries and enrollment, call or WhatsApp us at +91 9038413517
2 day online workshop on Bibliometric Analysis using R Studio & VOSviewer
This workshop is designed for research scholars, faculty members, postgraduate students, and early-career researchers, with the objective of building strong conceptual understanding and hands-on proficiency in bibliometric analysis, science mapping, and research evaluation using open-source tools.
📅 Date: Feb 14-15, 2026
🕖 Time: 7:00 PM - 9:00 PM (IST)
🌐 Location: Online (Zoom)
🔗 Sign Up Now
🚀 What You'll Learn?
Introduction to bibliometric analysis: concepts, types (performance analysis vs. science mapping), and applications in systematic literature reviews, research trend analysis, and journal/author/institution evaluation
Overview and comparison of bibliometric tools: R (Bibliometrix/Biblioshiny) and VOSviewer
Understanding bibliographic data sources and Data extraction : Scopus (coverage, strengths, and limitations) - Data extraction from Scopus (BibTeX/CSV formats) and best practices for search strategy design, time-span selection, and document-type filtering
Getting started with R Studio: environment setup, installing and loading key packages (bibliometrix, tidyverse, ggplot2, dplyr), setting working directories, and importing data using convert2df()
Hands-on descriptive bibliometric analysis using biblioshiney: annual scientific production, most productive authors, journals, institutions, and countries; citation analysis and key indicators (h-index, g-index, m-index)
Visualization of bibliometric results in R: publication trends, top authors/journals, collaboration plots, and exporting tables and figures
Introduction to science mapping and bibliometric networks: co-authorship, co-citation, bibliographic coupling, and keyword co-occurrence
Hands-on introduction to VOSviewer: interface overview, data import (Scopus and Bibliometrix-exported files), and creation of network, overlay, and density maps
Advanced mapping and interpretation in VOSviewer: collaboration networks, keyword clustering, temporal overlays, citation impact, and high-resolution map export
Integrating R and VOSviewer into a complete research workflow and structuring bibliometric outputs for research papers, PhD theses, and grant proposals
Tools Covered
• R Studio – Bibliometrix/Biblioshiny packages
• VOSviewer – Network, overlay, and density mapping
• Scopus Database – Data extraction and search strategy design
• R Packages – tidyverse, ggplot2, dplyr (for analysis & visualization)
🌟 Program Benefits:
Certificate of Participation from the prestigious Indaca Institute of Skills.
Networking opportunities with industry experts and peers.
Access to workshop materials and resources for continued learning.
🌟 Who Should Enroll:
• PhD Scholars & Research Scholars (all disciplines)
• Faculty Members & Academic Researchers
• Postgraduate & Final-Year Undergraduate Students
• Early-Career Researchers & Research Analysts
• Anyone involved in systematic literature review, research evaluation, or academic publishing
💰 Benefits of Choosing INDACA:
Certificate of Completion: Receive a recognized certificate upon completing the workshop, validating your proficiency in bibliometric analysis.
Session Recordings Access: Enjoy 1 year access to recorded sessions, allowing you to revisit key concepts and reinforce your learning at your own pace.
3-Month Post-Workshop Support: Receive dedicated support for three months post-workshop, ensuring continuous learning and guidance as you apply your skills.
Affordable Registration Fees: INDACA believes in accessible education. Register for the workshop at a nominal fee of INR 699/-
📞 For Inquiries (Call/WhatsApp): +91 9038413517

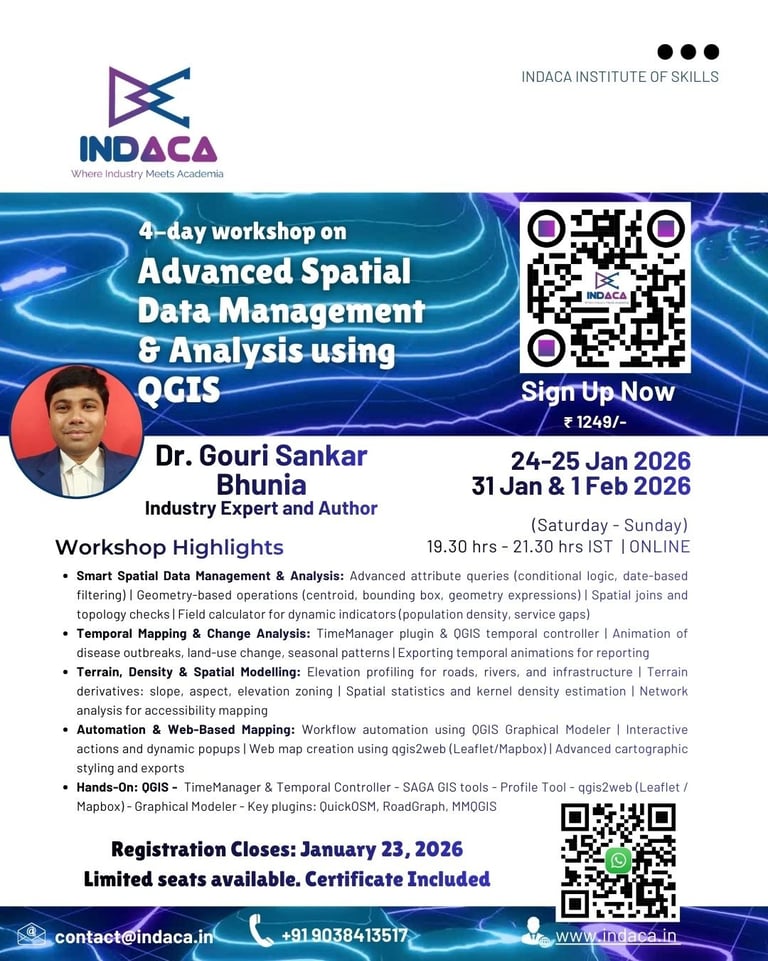
4 day online workshop on 4 day online workshop on Advanced Spatial Data Management & Analysis using QGIS
This hands-on workshop is designed to help participants move beyond basic GIS and confidently apply QGIS for real-world spatial problem solving. Through practical demonstrations and use-case-driven exercises, participants will learn how to analyze spatial patterns, visualize temporal change, automate workflows, and publish interactive web maps using open-source tools. The course bridges the gap between theory and application, making GIS skills immediately usable in academic, professional, and project-based contexts.
Dates: 24–25 January & 31 January–1 February 2026
Time: 7:30 PM –9:30 PM IST | Saturday and Sunday
Instructor: Dr. Gouri Sankar Bhunia, Industry Expert with 17+ years experience of geospatial technology
Organized by: Indaca Institute of Skills
Registration Closes: Jan 23, 2026
Mode: Online (via Zoom) - English
🚀 What You'll Learn?
Smart Spatial Data Management & Analysis: Advanced attribute queries (conditional logic, date-based filtering) | Geometry-based operations (centroid, bounding box, geometry expressions) | Spatial joins and topology checks | Field calculator for dynamic indicators (population density, service gaps)
Temporal Mapping & Change Analysis: TimeManager plugin & QGIS temporal controller | Animation of disease outbreaks, land-use change, seasonal patterns | Exporting temporal animations for reporting
Terrain, Density & Spatial Modelling: Elevation profiling for roads, rivers, and infrastructure | Terrain derivatives: slope, aspect, elevation zoning | Spatial statistics and kernel density estimation | Network analysis for accessibility mapping
Automation & Web-Based Mapping: Workflow automation using QGIS Graphical Modeler | Interactive actions and dynamic popups | Web map creation using qgis2web (Leaflet/Mapbox) | Advanced cartographic styling and exports
Hands-On: QGIS - TimeManager & Temporal Controller - SAGA GIS tools - Profile Tool - qgis2web (Leaflet / Mapbox) - Graphical Modeler - Key plugins: QuickOSM, RoadGraph, MMQGIS
🌟 Program Benefits:
Certificate of Participation from the prestigious Indaca Institute of Skills.
Networking opportunities with industry experts and peers.
Access to workshop materials and resources for continued learning.
🌟 Who Should Enroll:
Students & research scholars in Geography, GIS, Remote Sensing
Professionals in Urban Planning, Health, Environment, Agriculture
NGO and development sector practitioners
Government & consulting professionals working with spatial data
Anyone with basic QGIS knowledge looking to advance their skills
💰 Benefits of Choosing INDACA:
Certificate of Completion: Receive a recognized certificate upon completing the workshop, validating your proficiency in advanced QGIS
Session Recording: Access session recordings for 1 Year to revisit key concepts and reinforce your learning at your own pace.
3-Month Post-Workshop Support: Receive dedicated support for three months post-workshop, ensuring continuous learning and guidance as you apply your skills.
Affordable Registration Fees: INDACA believes in accessible education. Register for the workshop at a nominal fee of INR 1249/- or USD 20/-
📞 For Inquiries (Call/WhatsApp): +91 9038413517

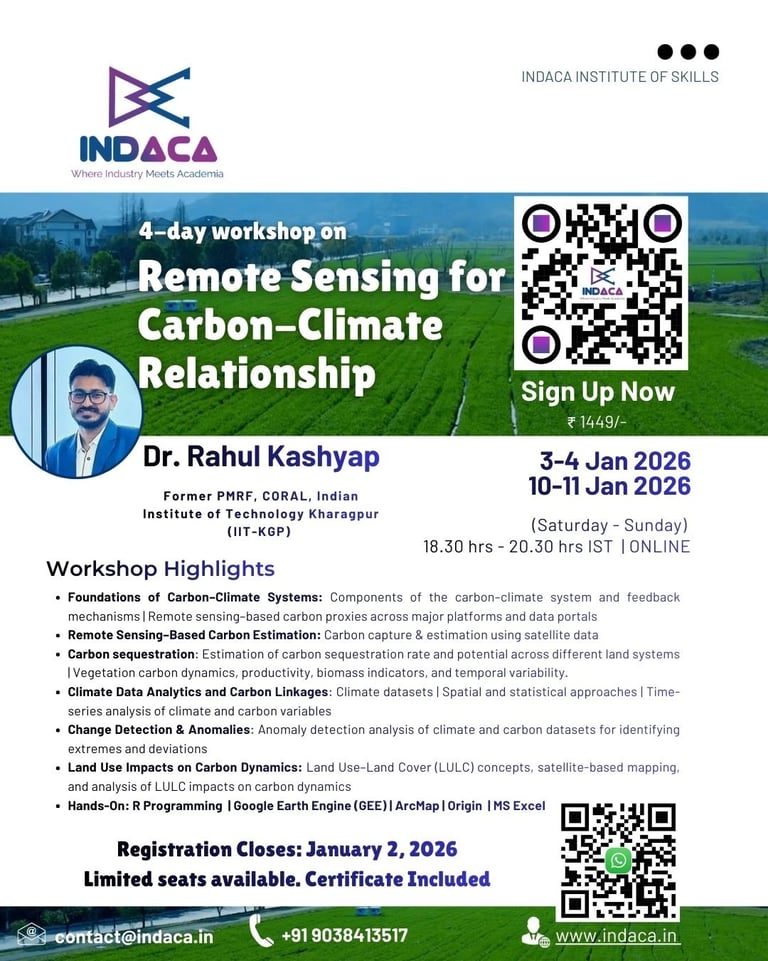
4 day online workshop on Remote Sensing for Carbon-Climate Relationship
The “Remote Sensing for Carbon–Climate Relationships” workshop is a 4-day live, hands-on training program designed to bridge theory with real-world applications. Participants will learn how to use satellite data, climate datasets, and geospatial platforms to assess carbon capture, sequestration, vegetation dynamics, climate variability, anomalies, and long-term trends.
The course is carefully structured from fundamental concepts to advanced analytical workflows, making it suitable for both beginners and experienced learners seeking applied skills.
📅 Date: Jan 2-3 and 10-11, 2026
🕖 Time: 6:30 PM - 8:30 PM (IST)
🌐 Location: Online (Zoom)
🔗 Sign Up Now
🚀 What You'll Learn?
Foundations of Carbon–Climate Systems: Carbon–climate relationships, system components, feedbacks, remote sensing basics, and carbon proxies from satellite data
Remote Sensing–Based Carbon Estimation: Carbon capture and sequestration concepts, estimation methods, sequestration rate and potential, and vegetation carbon dynamics
Climate Data Analytics & Carbon Linkages: Climate data exploration, climate–carbon interactions, and time-series analysis of variability and trends
Change Detection & Land Use Impacts: Anomaly detection, long-term climate–carbon trends, and LULC mapping with carbon impact assessment
Tools Covered
R Programming – Statistical computation & metrics
Google Earth Engine (GEE) – Cloud-based geospatial analysis & visualization
ArcMap– Spatial data handling and map visualization
Origin – Time-series analysis and plotting
MS Excel – Data handling and exploratory visualization
🌟 Program Benefits:
Certificate of Participation from the prestigious Indaca Institute of Skills.
Networking opportunities with industry experts and peers.
Access to workshop materials and resources for continued learning.
🌟 Who Should Enroll:
Students & Research Scholars (Geography, Environmental Science, Climate Science, GIS, Remote Sensing)
PhD & Master’s students working on carbon, climate, or sustainability themes
GIS & Remote Sensing professionals
Climate & environmental analysts
Urban, regional, and environmental planners
Academicians and early-career researchers
Anyone interested in carbon accounting and climate data analysis
💰 Benefits of Choosing INDACA:
Certificate of Completion: Receive a recognized certificate upon completing the workshop, validating your proficiency in remote sensing of carbon accounting.
Session Recordings Access: Enjoy 1 year access to recorded sessions, allowing you to revisit key concepts and reinforce your learning at your own pace.
3-Month Post-Workshop Support: Receive dedicated support for three months post-workshop, ensuring continuous learning and guidance as you apply your skills.
Affordable Registration Fees: INDACA believes in accessible education. Register for the workshop at a nominal fee of INR 1449/- or USD 20/-
📞 For Inquiries (Call/WhatsApp): +91 9038413517

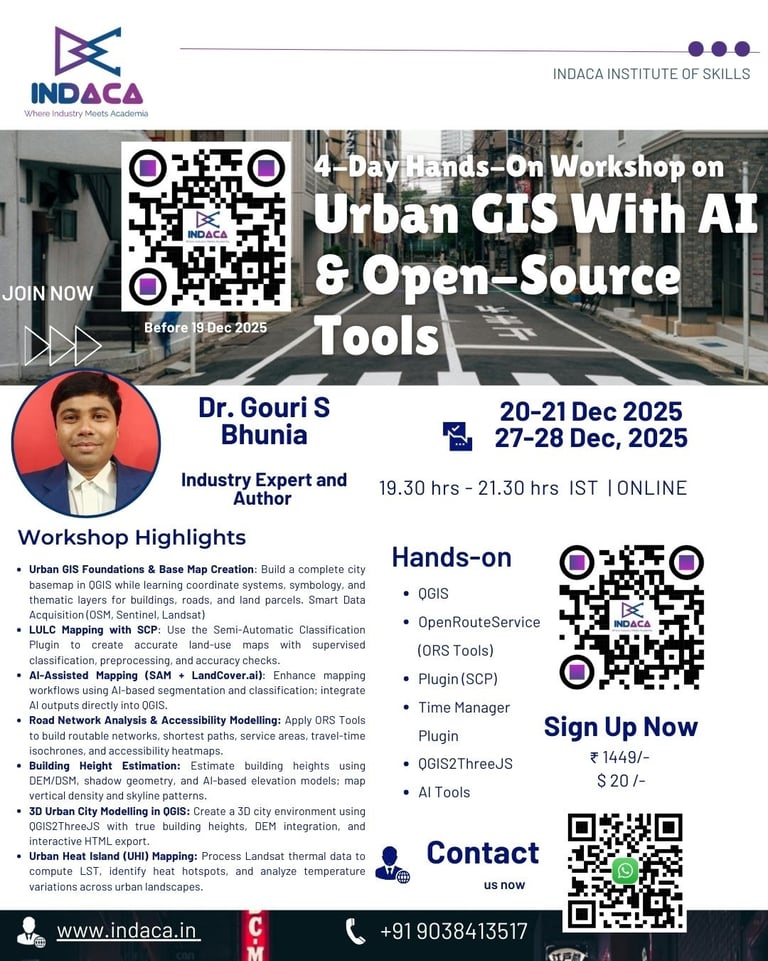
Join 5 Day Workshop on Urban Urban GIS With AI & Open-Source Tools
Learn to build complete urban maps, 3D city visualizations, building height models, heat island assessments, and accessibility networks using 100% free and open-source tools.
Perfect for beginners, yet powerful enough for advanced learners, this practical workshop takes you from zero to project-ready in just 4 days!
Course Details:
Dates: 20–21 & 27–28 Dec 2025
Timings: 7:30 PM to 9:30 PM IST | Saturday and Sunday
Mode: Online (Live, Interactive Sessions)
Focus: Hands-on training with real-world urban datasets
Certification: Certificate of Completion from the Indaca Institute of Skills
Instructor: Dr. Gouri S Bhunia – Passionate instructor from Industry with expertise in geospatial science.
What You’ll Learn
Urban GIS Foundations & Base Map Creation: Learn the essential concepts of Urban GIS while building a complete city-level basemap using QGIS. Understand coordinate systems, symbology, data types, and thematic map creation using real urban features such as buildings, roads, water bodies, and land parcels.
Smart Data Acquisition from Open Sources (OSM, Sentinel, Landsat): Master the use of QuickOSM and free satellite repositories to download building footprints, amenities, road networks, DEMs, and optical/thermal imagery. Learn filtering, exporting, and cleaning urban base layers to prepare ready-to-use datasets.
Land Use–Land Cover (LULC) Mapping With SCP: Perform supervised classification using the Semi-Automatic Classification Plugin. Create accurate LULC maps for built-up, vegetation, water, and barren areas. Includes preprocessing, training sample creation, accuracy assessment, and map refinement.
Urban Change Detection (2015–2025): Generate multi-temporal LULC maps and compute built-up expansion, loss of vegetation, and growth hotspots. Learn how to quantify urban change with pixel-by-pixel analysis, change matrices, and entropy-based change indicators.
AI-Assisted Urban Mapping (SAM + LandCover.ai): Explore beginner-friendly AI tools for segmentation and classification. Use the Segment Anything Model (SAM) for precise feature extraction and LandCover.ai outputs for enhanced LULC classification. Learn how to integrate AI results back into QGIS.
Road Network Analysis & Accessibility Modelling: Use ORS Tools to generate routable networks, identify shortest paths, and calculate accessibility to key services (schools, hospitals, markets). Create travel-time polygons (isochrones), accessibility heatmaps, and facility service areas.
Building Height Estimation: Extract height per building, calculate vertical density, and visualize city skyline patterns.
3D Urban City Modelling in QGIS: Create an interactive 3D urban environment using QGIS2ThreeJS. Extrude buildings to true height, integrate DEM, apply textures, and navigate a virtual 3D city model. Export your 3D scene as an interactive HTML file.
Urban Heat Island (UHI) Mapping Using Thermal Data: Process Landsat thermal bands to calculate Land Surface Temperature (LST). Overlay LST with LULC and building height layers to identify heat hotspots, high-rise heat pockets, and vulnerable neighborhoods.
Who Should Attend?
Urban Planners, GIS Analysts, and Environmentalists
Students, Researchers, and Academics in Urban Studies
Professionals in Infrastructure Development and Policy Making
Anyone keen on leveraging GIS for urban growth and sustainability
Why Choose This Course?
Hands-On Focus: Practical exercises tailored to real-world challenges.
Expert Trainers: Learn from professionals with industry and academic expertise.
Interactive Learning: Engage in live sessions with Q&A and expert guidance.
Recognized Certification: Boost your career with an accredited certificate.
Networking Opportunities: Connect with like-minded professionals and experts.
Interactive Sessions: Each session includes live coding, Q&A, and real-world applications.
Expert Instructor: Dr. Gouri S Bhunia – Passionate instructor from Industry with expertise in geospatial science will guide you through the course, ensuring a deep understanding of each concept.
Recorded Sessions: Can’t make it to a live session? Don’t worry—recorded sessions will be available for review at your convenience.
Transform your skills in urban planning with GIS and Remote Sensing!
📢 Seats are limited, so don’t miss out!
Registration Closes: 19 Dec 2025!

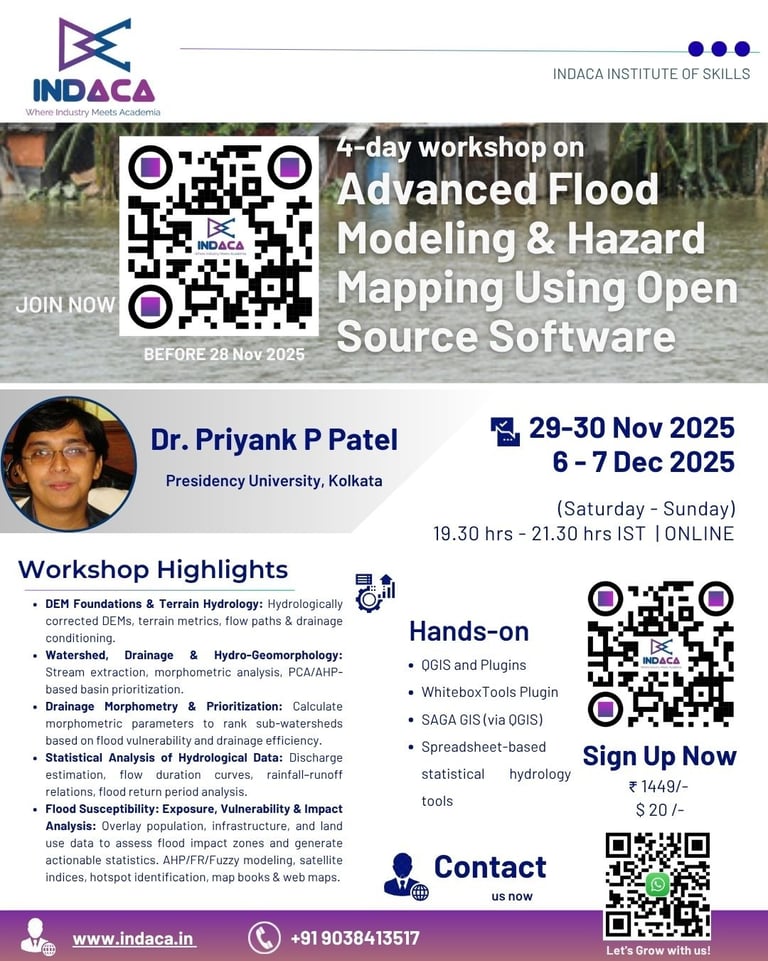
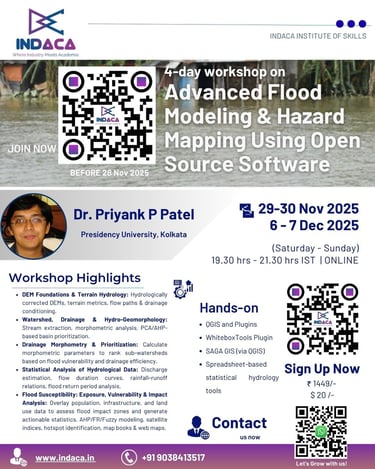
4 day Workshop on Advanced Flood Modeling & Hazard Mapping Using Open Source Software
A Practical 4-Day Weekend Workshop for Real-World Flood Risk Assessment
Join us for an immersive, hands-on online training hosted by the Indaca Institute of Skills, designed to equip you with the technical skills and geospatial tools needed for flood risk analysis and mapping.
📅 Date: Nov 29-30 and Dec 6-7, 2025
🕖 Time: 7:30 PM - 9:30 PM (IST)
🌐 Location: Online (Zoom)
🔗 Sign Up Now
🚀 What You'll Gain:
Prepare hydrologically conditioned DEMs for flood modeling
Delineate watersheds, drainage networks & morphometric parameters
Perform rainfall–runoff analysis & flood return period estimation
Create flood susceptibility maps using AHP, Frequency Ratio & Fuzzy Logic
Identify exposure & vulnerability hotspots
Generate professional print maps & interactive web maps
Apply fully open-source tools for hydrological and flood risk analysis
🌟 Course Highlights:
DEM Foundations & Terrain Hydrology : Hydrologically corrected DEMs, terrain metrics, flow paths & drainage conditioning.
Watershed, Drainage & Hydro-Geomorphology: Stream extraction, morphometric analysis, PCA/AHP-based basin prioritization.
Statistical Analysis of Hydrological Data: Discharge estimation, flow duration curves, rainfall–runoff relations, flood return period analysis.
Flood Susceptibility + Exposure, Vulnerability & Final Map Production: AHP/FR/Fuzzy modeling, satellite indices, hotspot identification, map books & web maps.
🌟 Program Benefits:
Certificate of Participation from the prestigious Indaca Institute of Skills.
Networking opportunities with industry experts and peers.
Access to workshop materials and resources for continued learning.
Enhanced skills and knowledge to boost your career in remote sensing and flood modelling.
🌟 Who Should Enroll:
Students & Researchers in geography, geology, civil engineering, disaster management
GIS Analysts & Urban Planners working on hydrology, flood zones, and terrain-based studies
Professionals in government, environmental consultancies, and NGOs
Academics & Educators interested in integrating practical flood modeling tools into curricula
💰 Benefits of Choosing INDACA:
Certificate of Completion: Receive a recognized certificate upon completing the workshop, validating your proficiency in flood analysis.
Session Recordings Access: Enjoy 1 year access to recorded sessions, allowing you to revisit key concepts and reinforce your learning at your own pace.
3-Month Post-Workshop Support: Receive dedicated support for three months post-workshop, ensuring continuous learning and guidance as you apply your skills.
Affordable Registration Fees: INDACA believes in accessible education. Register for the workshop at a nominal fee of INR 1449/- or USD 20/-
📞 For Inquiries (Call/WhatsApp): +91 9038413517
Limited seats! Don’t miss this opportunity to upskill in flood risk mapping.
5 day online workshop on
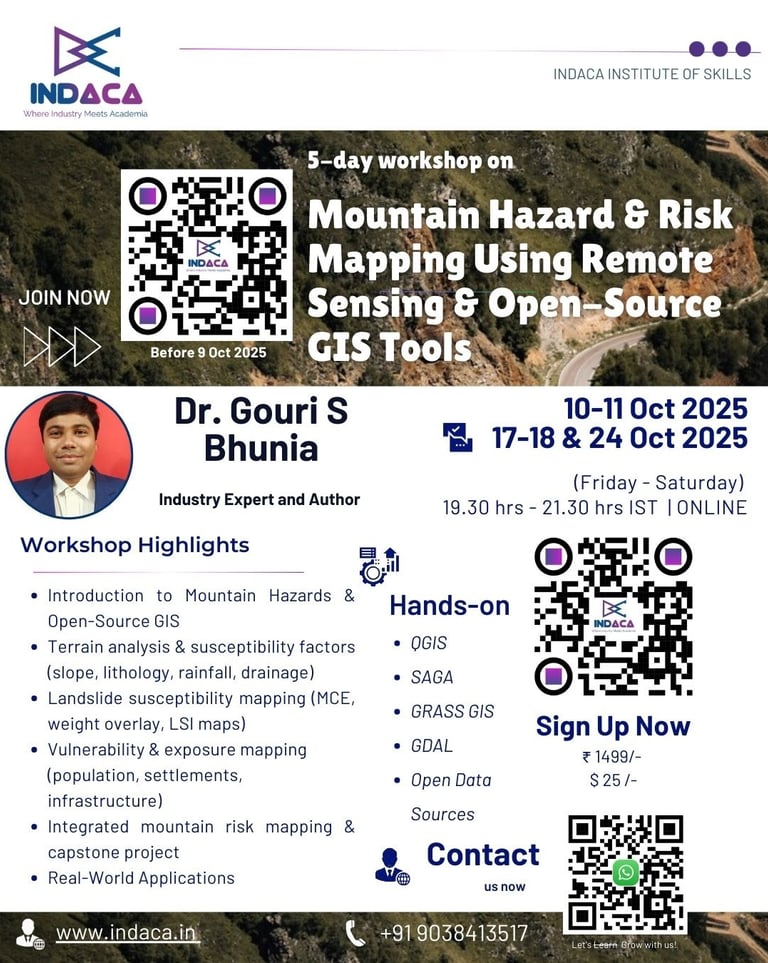
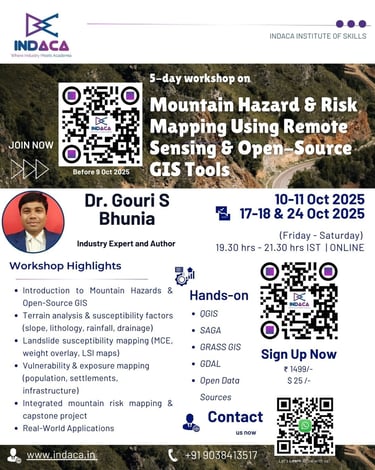
Mountain Hazard & Risk Mapping Using Remote Sensing & Open-Source GIS Tools
Master Practical Skills in Remote Sensing & Open-Source GIS for Mountain Hazard and Risk Assessment.
Mountain regions face frequent hazards such as landslides, rockfalls, debris flows, avalanches, and glacial lake outburst floods (GLOFs). Understanding these risks and mapping them effectively is essential for researchers, planners, and policymakers working in fragile ecosystems.
This 5-day live online workshop will guide you step by step in using open-source GIS tools like QGIS, SAGA, and GRASS to analyze terrain, identify hazard-prone areas, and generate risk zonation maps. With a hands-on approach, you will not only learn the science behind hazard and risk mapping but also gain practical skills to apply in real-world mountain environments.
Course Details:
Dates: Oct 10-11 and Oct 17-18 & Oct 24, 2025
Duration: 5 Days | 2 Hours per Day | Total 10 Hours
Timings: 7:30 PM – 9:30 PM IST
Mode: Live Online via Zoom
Language of Instruction: English
Certificate: E-Certificate of Participation
Instructor: Dr. Gouri Sankar Bhunia, Remote Sensing and GIS Specialists | Author | 16+ years of industrial and academic experience
Workshop Highlights
In-depth understanding of mountain hazards and slope movement processes
Step-by-step training in terrain analysis and susceptibility factor preparation
Practical experience in landslide susceptibility and risk zonation mapping
Exposure to open datasets (DEM, rainfall, geology, LULC, OSM)
Skills to create vulnerability and exposure maps using population and infrastructure data
Ability to integrate hazard, vulnerability, and exposure for comprehensive risk assessment
Confidence to export and publish professional-quality maps for reports and research
Who Should Attend?
Researchers & Academics: In environmental science, geography, agriculture, hydrology, and disaster management
University faculty and students working on mountain ecosystems
Students & Scholars: Pursuing projects in remote sensing, GIS, or environmental monitoring.
GIS professionals in consulting, government, and NGOs
Disaster management practitioners and planners
Anyone keen to apply open-source geospatial tools for hazard & risk mapping
Why Choose This Course?
Live + Recorded Access
Expert Instructor: Dr. Gouri S Bhunia brings deep expertise from academia and industry.
Industry-Relevant Tools: Work on real-world datasets
Get Certified
Emphasis on open-source tools – no expensive software needed
Registration Closes: October 9, 2025
Don’t miss the chance to master hazard and risk mapping for mountain environments. Secure your seat today and take your GIS skills to the next level!
Registration Closes: Oct 9, 2025
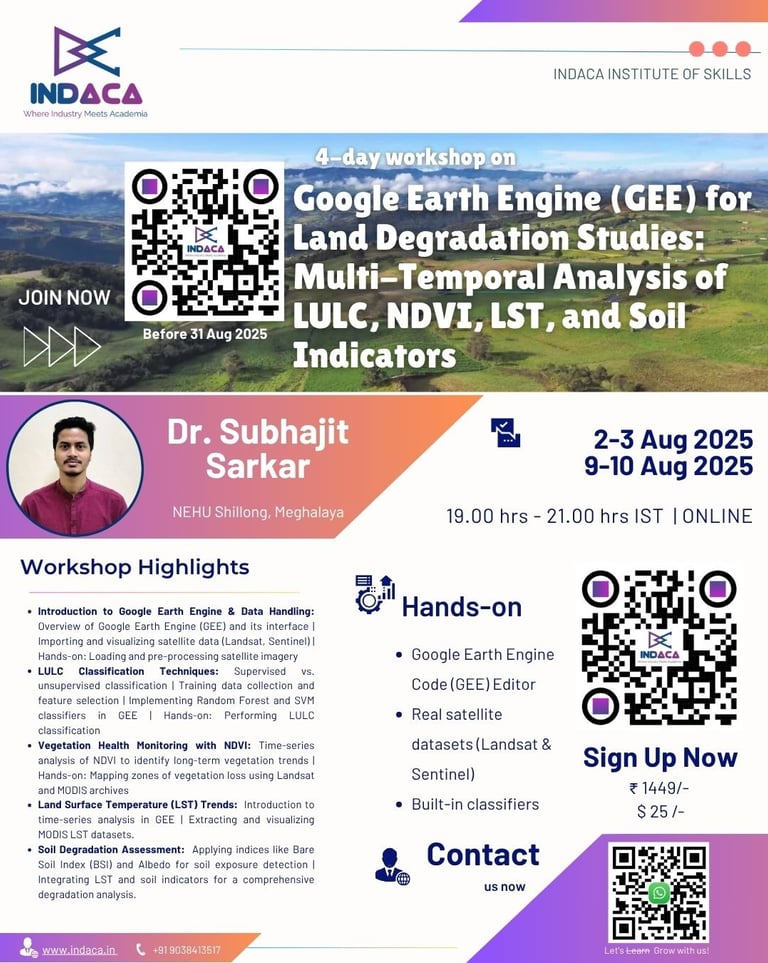
4 day Workshop on Google Earth Engine for Land Degradation Studies: Multi-Temporal Analysis of LULC, NDVI, LST, and Soil Indicators
Land degradation poses serious environmental, social, and economic challenges worldwide. This specialized 4-day live online workshop is designed to help participants gain practical skills in leveraging Google Earth Engine (GEE) for analyzing multi-temporal satellite datasets to monitor land degradation. Through hands-on sessions, you will learn to assess key indicators such as LULC (Land Use Land Cover) changes, NDVI (Vegetation Loss), LST (Land Surface Temperature), and Soil Degradation indices using remote sensing datasets and geospatial analysis techniques.
Whether you are a researcher, environmental consultant, GIS analyst, academician, or a student, this workshop will provide you with actionable insights and technical know-how for environmental monitoring, reporting, and scientific research.
Course Details:
Dates: Aug 2-3 & 9-10, 2025 (Weekends)
Time: 7:00 PM – 9:00 PM IST
Duration: 8 hours (2 hours/day × 4 days)
Mode: Live Online (via Zoom)
Certificate: E-Certificate of Participation
Instructor: Dr. Subhajit Sarkar, Dept. of Geography, NEHU Shillong - Passionate instructor with expertise in GEE, Python and R for geospatial science.
Workshop Highlights
Live hands-on sessions on Google Earth Engine (GEE)
Structured, hands-on training on monitoring land degradation through Google Earth Engine (GEE)
Step-by-step guidance on analyzing multi-temporal satellite datasets for land cover, vegetation health, temperature trends, and soil indicators
Practical exercises to build capacity in remote sensing, geospatial analysis, and environmental monitoring
Real-world applications aligned with research, project reporting, and environmental management needs
Led by experienced domain experts with significant academic and applied research credentials
What You’ll Learn:
Introduction to GEE & Data Handling
Overview of the GEE platform and its interface
Importing, filtering, and visualizing satellite data (Landsat, Sentinel)
Spectral indices: NDVI, NDBI, NDWI
Hands-on: Image loading, visualization, and pre-processing in GEE
LULC Classification Techniques
Supervised vs. unsupervised classification approaches
Creating training datasets and feature selection
Implementing Random Forest and Support Vector Machines (SVM) in GEE
Hands-on: Perform classification and generate LULC maps
Vegetation Health Monitoring with NDVI
Vegetation Health Monitoring with NDVI
Time-series analysis of NDVI to identify long-term vegetation trends
Mapping zones of vegetation loss using Landsat and MODIS archives
Land Surface Temperature (LST) Trends
Extracting and visualizing MODIS LST datasets
Correlating temperature changes with vegetation loss and soil degradation
Soil Degradation Assessment
Applying indices like Bare Soil Index (BSI) and Albedo for soil exposure detection
Integrating LST and soil indicators for a comprehensive degradation analysis
Tools and Technologies
Google Earth Engine (GEE) – For cloud-based satellite data processing and analysis
Remote Sensing Datasets – Landsat, MODIS for multi-temporal analysis
Spectral Indices – NDVI, BSI, Albedo for land degradation indicators
Data Visualization Tools – GEE charting, mapping, and exporting features
Who Should Attend?
Remote Sensing and GIS Professionals
Environmental Researchers and Scientists
Data Scientists Exploring Geospatial ML
Policy Makers, NGOs & Research Analysts
Geospatial Professionals (GIS, Remote Sensing Analysts)
Academicians and PhD Scholars
Climate and Land Management Consultants
Postgraduate Students in Geography, Environmental Science, Agriculture, Planning, Earth Sciences
Why Choose This Course?
Live + Recorded Access
Expert Instructor: Dr. Subhajit Sarkar brings deep expertise from academia
Industry-Relevant Tools: Work on real-world datasets
Get Certified
No Prior Coding Required – All tools are cloud-based and user-friendly
Don't Miss Out! If you’re passionate about geospatial technology and want to master land degradation mapping with Google Earth Engine - this workshop is for you!
Registration Closes: July 31, 2025

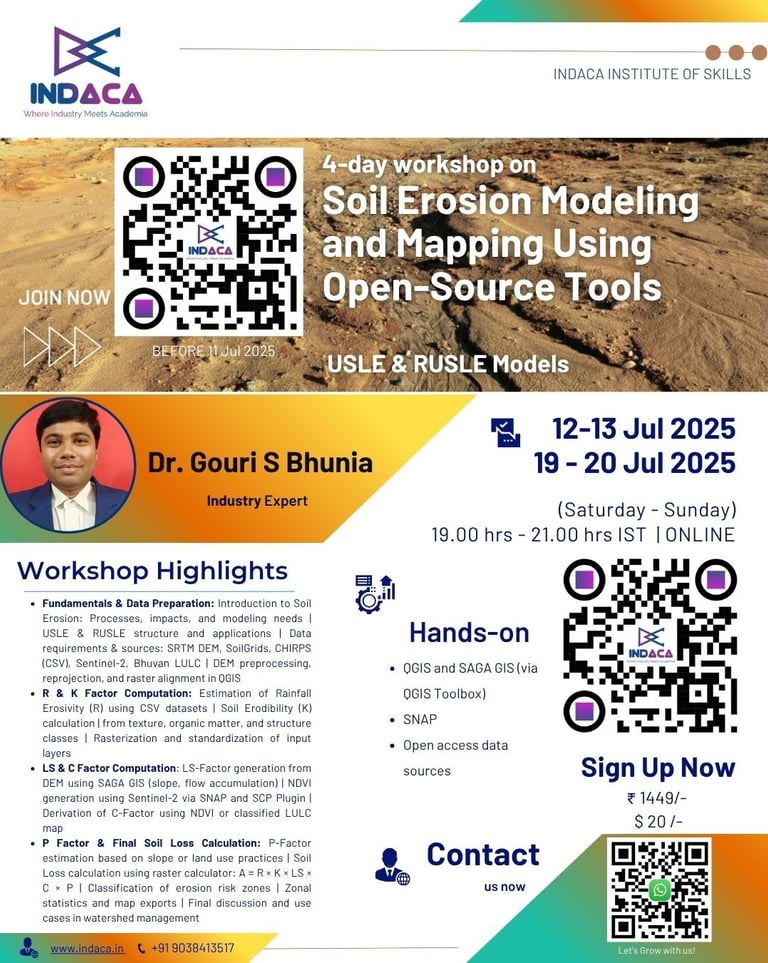
4 day Workshop on Soil Erosion Modelling and Mapping Using Open-Source Tools | USLE & RUSLE Models
Soil erosion is one of the most pressing environmental issues affecting agriculture, water quality, and land sustainability. Understanding and modeling soil loss using geospatial technologies is essential for environmental researchers, planners, and policy-makers. This 4-day live online hands-on workshop offers participants the opportunity to learn and apply the USLE and RUSLE models using open-source GIS tools (QGIS, SAGA GIS, SNAP).
Join us for an immersive, hands-on online training hosted by the Indaca Institute of Skills, designed to equip you with the technical skills and geospatial tools needed for soil erosion mapping and modelling.
📅 Dates: July 12–13 & 19–20, 2025 (Saturday & Sunday)
🕖 Time: 7:00 PM – 9:00 PM IST (Each Day)
🌐 Mode: Live Online via Zoom
🎓 Resource Person: Dr. Gouri Sankar Bhunia
🔗 Sign Up Now
🚀 What You'll Gain:
Understand the principles of soil erosion and the USLE/RUSLE modeling framework
Compute individual factors: R (Rainfall), K (Soil), LS (Topography), C (Land Cover), and P (Support Practices)
Work with open-source data such as DEMs, rainfall records, and soil maps
Perform NDVI analysis and land use classification using remote sensing techniques in SNAP/QGIS
Calculate and map soil loss using raster analysis in QGIS
Perform zonal statistics and interpret erosion risk maps
Generate publication-ready maps and results using only open tools
🌟 Course Highlights:
Fundamentals & Data Preparation: Introduction to Soil Erosion: Processes, impacts, and modeling needs | USLE & RUSLE structure and applications | Data requirements & sources: SRTM DEM, SoilGrids, CHIRPS (CSV), Sentinel-2, Bhuvan LULC | DEM preprocessing, reprojection, and raster alignment in QGIS
R & K Factor Computation: Estimation of Rainfall Erosivity (R) using CSV datasets | Soil Erodibility (K) calculation | from texture, organic matter, and structure classes | Rasterization and standardization of input layers
LS & C Factor Computation: LS-Factor generation from DEM using SAGA GIS (slope, flow accumulation) | NDVI generation using Sentinel-2 via SNAP and SCP Plugin | Derivation of C-Factor using NDVI or classified LULC map
P Factor & Final Soil Loss Calculation: P-Factor estimation based on slope or land use practices | Soil Loss calculation using raster calculator: A = R × K × LS × C × P | Classification of erosion risk zones | Zonal statistics and map exports | Final discussion and use cases in watershed management
Web & Print Map Creation: Design professional printable maps and build interactive maps.
🌟 Program Benefits:
Certificate of Participation from the prestigious Indaca Institute of Skills.
Networking opportunities with industry experts and peers.
Access to workshop materials and resources for continued learning.
Enhanced skills and knowledge to boost your career in remote sensing and soil erosion.
🌟 Who Should Enroll:
Students & Researchers in geography, geology, civil engineering, disaster management
GIS Analysts & Urban Planners working on soil erosion, and terrain-based studies
Professionals in government, environmental consultancies, and NGOs
Academics & Educators interested in integrating practical soil erosion modelling tools into curricula
💰 Benefits of Choosing INDACA:
Certificate of Completion: Receive a recognized certificate upon completing the workshop, validating your proficiency in soil erosion modelling.
Session Recordings Access: Enjoy 1 year access to recorded sessions, allowing you to revisit key concepts and reinforce your learning at your own pace.
3-Month Post-Workshop Support: Receive dedicated support for three months post-workshop, ensuring continuous learning and guidance as you apply your skills.
Affordable Registration Fees: INDACA believes in accessible education. Register for the workshop at a nominal fee of INR 1449/- or USD 20/-
📞 For Inquiries (Call): +91 7439308037
(WhatsApp): +91 9038413517
Don't miss this opportunity to revolutionize your agricultural research! Register Now!
5 day Workshop-cum-hands-on-training on Python for Geospatial Sciences: From Basics to Automation!
This 5-day hands-on workshop is designed to introduce participants to Python programming for geospatial applications. It progressively builds skills in spatial data processing, visualization, and automation using Python libraries like GeoPandas, Rasterio, Folium, and NumPy.
The course is tailored for GIS professionals, researchers, and students who are comfortable with basic GIS concepts but new to Python. By the end of the program, participants will be able to handle both vector and raster geospatial data, perform spatial analysis, and automate workflows using real-world datasets.
Course Details:
Dates: May 23, 24, 30, 31 & June 7, 2025 (Fridays & Saturdays)
Time: 7:00 PM – 9:00 PM IST
Mode: Online (Live & Hands-on)
Skill Level: Beginners with basic GIS knowledge, no prior Python experience
Duration: 5 Days | 2 Hours per Day | Total 10 Hours
Language of Instruction: English
Certificate: E-Certificate of Participation
Workshop Highlights
5 Days of Live Hands-On Sessions – Learn by doing with structured 2-hour weekend classes (Friday & Saturday evenings).
No Prior Python Knowledge Needed – Designed for beginners with basic GIS understanding.
End-to-End Learning Path – From Python fundamentals to real-world geospatial automation.
Practical Tools & Libraries – Master GeoPandas, Rasterio, NumPy, and Folium for spatial data analysis and visualization.
Mini Project on Final Day – Apply your learning in a guided mini-project using real spatial data.
Interactive Mapping – Build and export web-based interactive maps with Folium.
Expert Instruction – Learn from Dr. Subhajit Sarkar, a domain expert in geospatial data science.
Session Recordings Access – Get exclusive access to recordings via your registered Gmail account.
Certificate of Participation – Issued by Indaca Institute of Skills upon completion.
What You’ll Learn:
Python +Spatial Data Fundamentals
Installing Anaconda and setting up Jupyter Notebooks
Python fundamentals:
Variables, data types (strings, numbers, lists)
Writing basic loops and functions
Introduction to spatial data types: Vector vs Raster
Loading and visualizing a shapefile using GeoPandas
Vector Data Analysis with GeoPandas
Coordinate Reference Systems (CRS): Basics and reprojection
Attribute filtering and selection
Spatial operations:
Buffering
Spatial join
One geometry method (e.g., intersects() or centroid())
Raster Data + NDVI Computation
What is raster data? (bands, resolution, extent)
Loading GeoTIFF using Rasterio
Raster to NumPy array conversion
NDVI calculation using Red and NIR bands
Raster clipping using shapefile masks
Interactive Mapping with Folium and Workflow Automation + Mini Project Showcase
Introduction to Folium and Leaflet-based maps
Creating base maps
Adding markers and polygons from GeoDataFrames
Building choropleth maps based on attribute data
Exporting maps as standalone HTML
Automating tasks using loops and functions
Batch processing examples:
NDVI computation for multiple rasters
Buffer multiple shapefiles
Mini project: Apply everything learned
Project options (participants choose one):
Land cover change NDVI analysis
Spatial accessibility mapping
Thematic mapping from census data
Tools and Technologies
Python Environment
Anaconda – Python distribution with package and environment management
Jupyter Notebook – Interactive coding and visualization platform
Vector Data Handling
GeoPandas – For reading, analyzing, and visualizing shapefiles and GeoJSON data
Shapely – For geometric operations like buffer, centroid, and intersects
Raster Data Analysis
Rasterio – For reading, writing, and clipping GeoTIFF raster files
NumPy – For raster band math (e.g., NDVI computation)
Interactive Mapping
Folium – For creating web-based interactive maps and choropleths
Supporting Tools
QGIS (optional reference) – For spatial data preparation (optional, not used in core hands-on)
Basic CSV/Excel Data – For attribute enrichment and visualization
Who Should Attend?
Students in Geography, Environmental Science, Urban Planning, Agriculture, and related fields
GIS Analysts and Technicians seeking to enhance their workflow with Python automation
Researchers and Academics working on spatial data analysis and visualization
Beginners in Python Programming with an interest in spatial applications
Educators and Trainers aiming to integrate Python-based GIS in their curriculum
Professionals in Remote Sensing, Planning, and Development sectors
No prior experience in Python is required. Basic familiarity with GIS concepts is recommended.
Why Choose This Course?
Live + Recorded Access
Expert Instructor: Dr. Subhajit Sarkar brings deep expertise from academia
Industry-Relevant Tools: Work on real-world datasets
Get Certified
No Prior Coding Required – All tools are cloud-based and user-friendly
Don't Miss Out!
If you're passionate about geospatial technology and eager to master Python for mapping and automation, this workshop is designed just for you!
Registration Closes: May 22, 2025
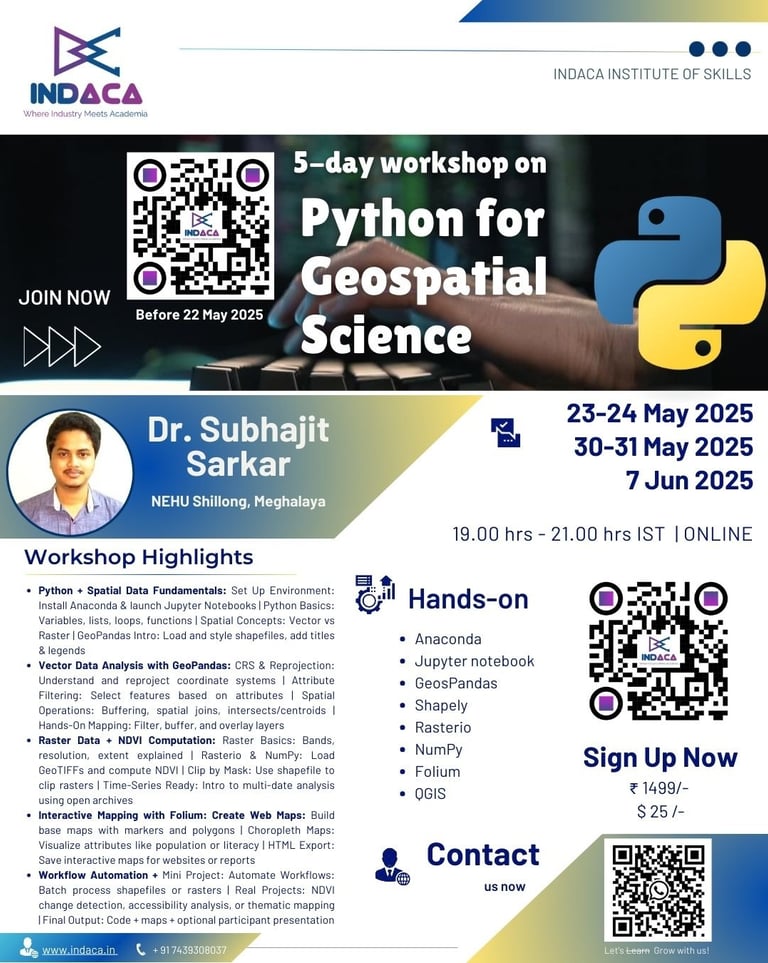
2 day workshop Fundamental Statistics for Beginners with SPSS!
Take your first step into the world of applied statistics with this immersive, hands-on workshop. Designed for researchers, students, and professionals, this workshop focuses on building a strong foundation in statistical analysis using SPSS.
Workshop Highlights
🗓️ Dates: April 5 - 6, 2025 (Saturday to Sunday)
Introduction to Fundamental Statistics
SPSS basics: Interface, navigation, and functionalities.
Data entry, cleaning, and variable coding.
Descriptive statistics: Measures of central tendency and dispersion.
Data Exploration and Visualization
Handle missing data and outliers.
Create visualizations: Bar charts, histograms, scatter plots, and box plots.
Hypothesis Testing with t-tests and ANOVA
Understand null and alternative hypotheses.
Perform t-tests (one-sample and independent) and ANOVA.
Correlation and Categorical Data Analysis
Analyze variable relationships using Pearson and Spearman correlation.
Conduct chi-square tests for categorical data analysis.
Visualize findings with scatter plots and cross-tabulations.
🎓 Who can join?
Students: Enhance your academic journey by gaining practical statistical skills applicable in research and coursework.
Professionals: Amplify your analytical capabilities, making informed decisions and contributing to data-driven strategies in your professional domain.
Researchers: Equip yourself with the tools needed for robust data analysis, ensuring the validity and reliability of research findings.
Anyone Seeking Statistical Proficiency: Whether you are a beginner or looking to refine your statistical skills, this workshop caters to all levels.
🌐 Benefits of Choosing INDACA:
Certificate of Completion: Receive a recognized certificate upon completing the workshop, validating your proficiency in fundamental statistics.
Session Recordings Access: Enjoy access to recorded sessions, allowing you to revisit key concepts and reinforce your learning at your own pace.
3-Month Post-Workshop Support: Receive dedicated support for three months post-workshop, ensuring continuous learning and guidance as you apply your skills.
Affordable Registration Fees: INDACA believes in accessible education. Register for the workshop at a nominal fee of INR 699/- or USD 12/-.
Important Date: Register before April 4, 2025, to secure your spot.
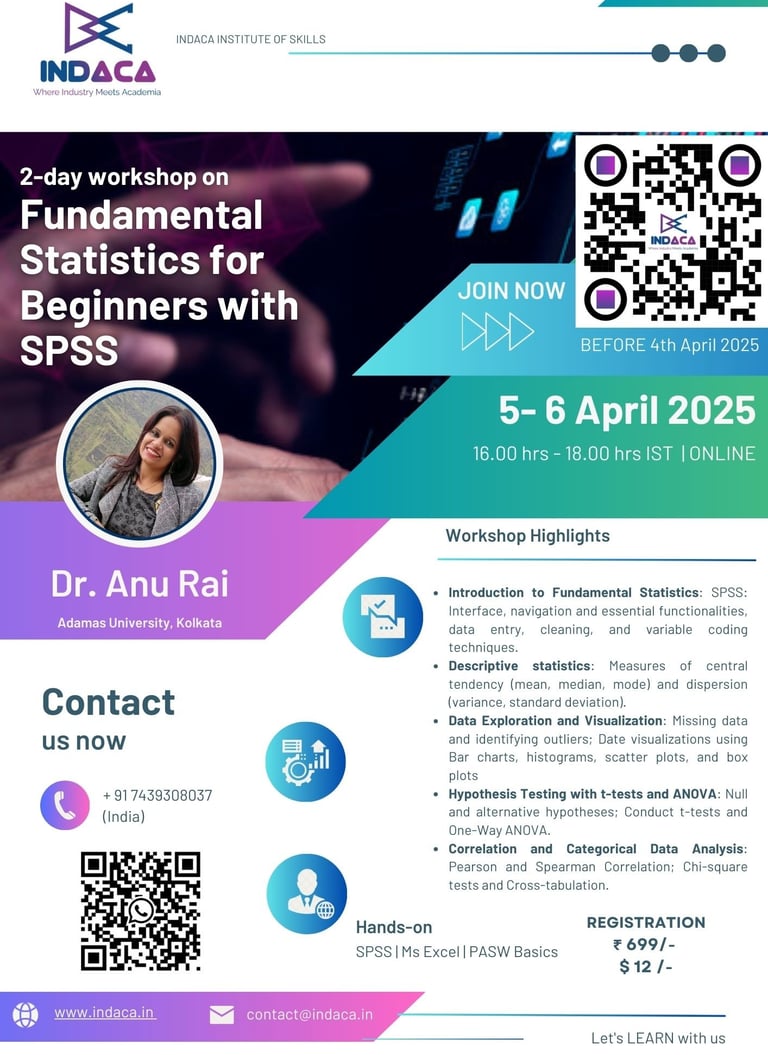
Join 5-Day Workshop on Spatial Data Analysis & Modeling Using R!
This comprehensive hands-on workshop is designed for GIS professionals, data scientists, and researchers eager to master spatial data analysis using R and RStudio. Learn to manipulate, visualize, and model spatial data using industry-standard open-source tools while working on real-world datasets in an interactive, practical setting.
What You'll Gain:
Master Spatial Data Handling – Import, manipulate, and analyze spatial datasets (Shapefiles, GeoTIFFs).
Explore Spatial Patterns – Conduct Exploratory Spatial Data Analysis (ESDA) and understand spatial relationships using Moran’s I and Geary’s C.
Apply Geostatistical Techniques – Implement spatial interpolation methods like Inverse Distance Weighting (IDW) and Kriging for spatial predictions.
Perform Spatial Regression – Build and interpret spatial regression models (SLM, SEM) for advanced spatial analysis.
Hands-On Practice – Gain practical experience with RStudio and essential R packages (sf, ggplot2, spdep, gstat, spatialreg).
📊 Course Highlights:
Introduction to R for Spatial Analysis: Setting up R and RStudio for geospatial tasks | Importing and handling spatial data| Understanding R’s spatial libraries
Spatial Data Manipulation & Visualization: Data manipulation with dplyr and sf packages | Visualizing spatial data using ggplot2 and tmap | Creating thematic maps and custom visual outputs
Exploratory Spatial Data Analysis (ESDA): Identifying spatial patterns and relationships | Spatial autocorrelation: Moran’s I and Geary’s C | Interpreting spatial distribution insights
Geostatistical Techniques & Spatial Prediction: Introduction to interpolation: IDW and Kriging | Building and evaluating spatial prediction models | Hands-on implementation of spatial interpolation
Spatial Regression & Advanced Modeling: Understanding spatial lag and spatial error models (SLM, SEM) | Model diagnostics and interpretation of spatial outputs | Applying spatial regression to real-world datasets
Mark your calendars for March 23-24 and March 29-31, 2025 as the program kicks off with weekend sessions held on Saturdays and Sundays, totaling 4-6 hours of live classes and projects. Join us online via Zoom Meet from 19:00 HRS to 21:00 HRS (IST) and unlock your potential in the world of bibliometric study.
🎓 Who can join?
GIS Professionals: Enhance your geospatial modeling expertise with advanced techniques.
Data Scientists: Apply spatial analysis to complex datasets and derive actionable insights.
Researchers & Academicians: Analyze geographic patterns for real-world applications in urban and environmental studies.
Urban & Environmental Planners: Integrate spatial analytics into planning and policy decisions.
Students & Aspiring Analysts: Build a strong foundation in spatial statistics and modeling
Benefits of Choosing INDACA:
Certificate of Completion: Receive a recognized certificate from Indaca Institute of Skills, validating your spatial data expertise.
Session Recordings Access: Get access to recorded sessions to revisit and reinforce your learning anytime.
3-Month Post-Workshop Support: Enjoy continued guidance and assistance as you apply your new skills.
Affordable Registration Fees: Join the workshop for just INR 1499/- or USD 20/-—making advanced learning accessible.
Enrollment is now open, with registration closing on 22March 2025. Get ready to transform raw data into actionable insights! Join us to simplify bibliometric analysis and elevate your research. For inquiries and enrollment, call or WhatsApp us at +91 7439308037.
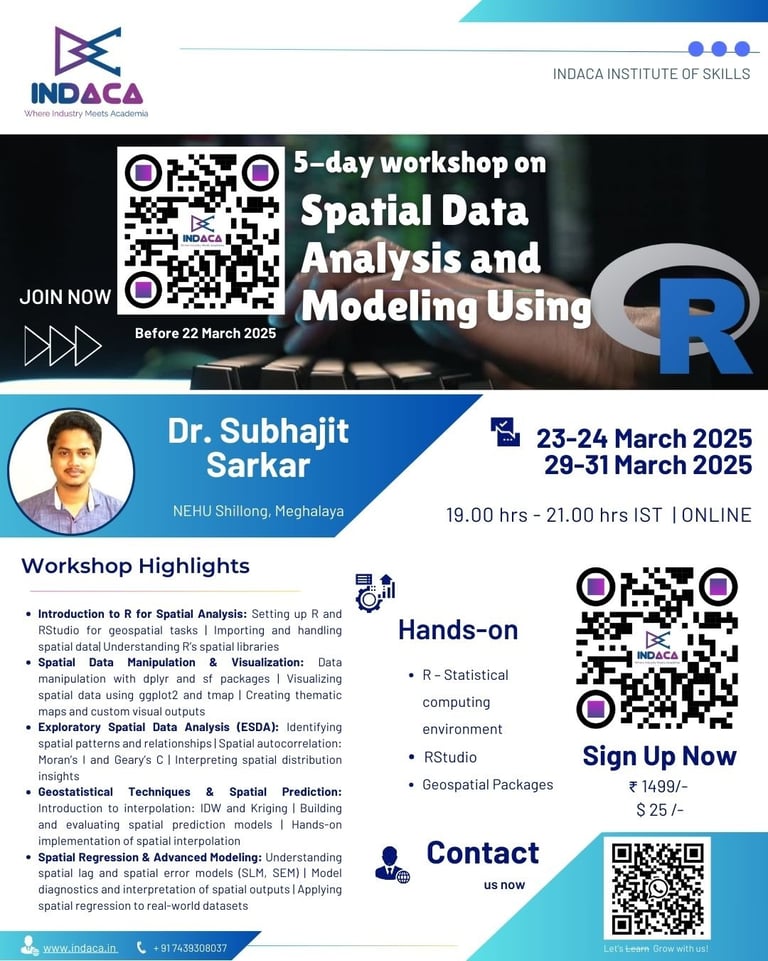
Join 2 day Workshop on Bibliometric Analysis with Open-Source Tools!
This workshop is designed for researchers, academicians, and professionals looking to harness the potential of open-source tools like VoSviewer for bibliometric analysis. Learn how to explore research trends, evaluate academic impact, and visualize collaboration networks in an interactive and practical setting.
What You'll Gain:
Understand the fundamentals of bibliometric analysis and its applications.
Explore research trends, co-authorship networks, and thematic clusters.
Gain hands-on experience with VoSviewer and other open-source tools.
Learn to create stunning visualizations and actionable bibliometric reports.
📊 Course Highlights:
Introduction to bibliometric concepts and indicators.
Overview of open-source tools like VoSviewer.
Hands-on: Data preparation and importing datasets.
Visualizing basic networks (co-authorship, keyword co-occurrence)
Advanced bibliometric mapping techniques.
Customizing visualizations for meaningful insights.
Exporting data and creating bibliometric reports.
Hands-on: Analyzing case studies and trends over time.
Mark your calendars for March 8-9, 2025 as the program kicks off with weekend sessions held on Saturdays and Sundays, totaling 4-6 hours of live classes and projects. Join us online via Zoom Meet from 16:00 HRS to 18:00 HRS (IST) and unlock your potential in the world of bibliometric study.
🎓 Who can join?
Researchers and academicians seeking to analyze publication trends.
Students interested in advanced research methodologies.
Librarians and policymakers focusing on academic evaluation and decision-making.
Benefits of Choosing INDACA:
Certificate of Completion: Receive a recognized certificate upon completing the workshop, validating your proficiency in fundamental statistics.
Session Recordings Access: Enjoy access to recorded sessions, allowing you to revisit key concepts and reinforce your learning at your own pace.
3-Month Post-Workshop Support: Receive dedicated support for three months post-workshop, ensuring continuous learning and guidance as you apply your skills.
Affordable Registration Fees: INDACA believes in accessible education. Register for the workshop at a nominal fee of INR 749/- or USD 15/-.
Enrollment is now open, with registration closing on 7 March 2025. Get ready to transform raw data into actionable insights! Join us to simplify bibliometric analysis and elevate your research. For inquiries and enrollment, call or WhatsApp us at +91 7439308037.
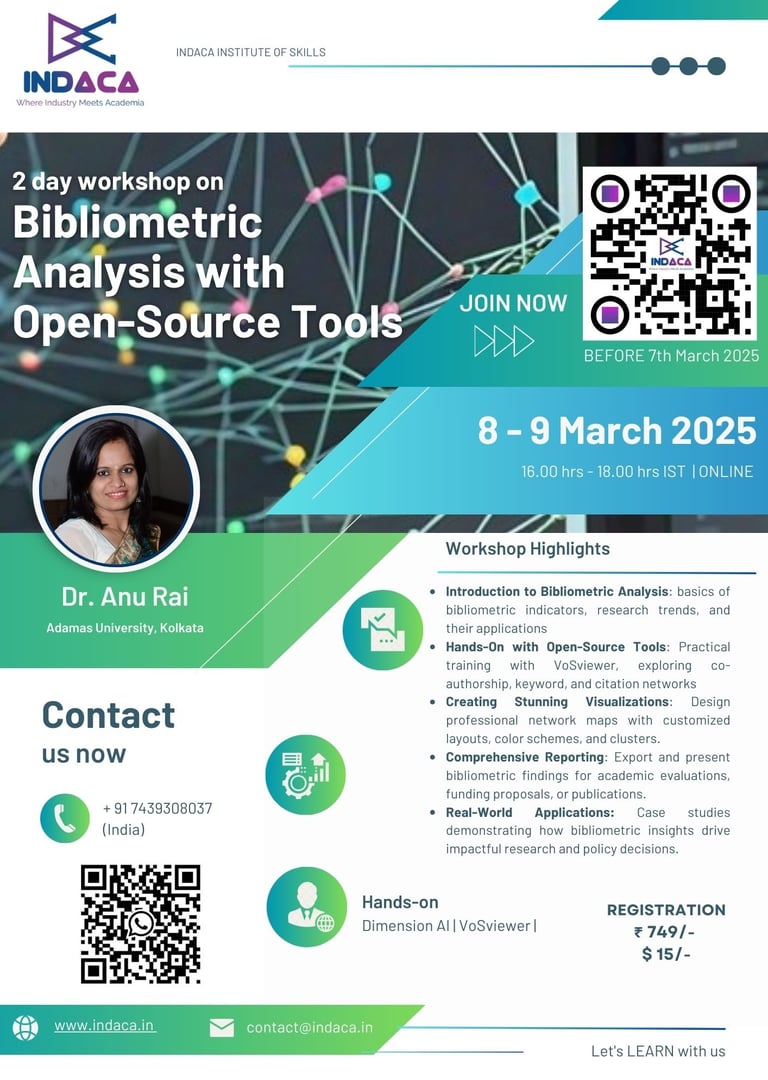
Join 4 Day Workshop on Land Use Land Cover (LULC) Mapping with Hyperspectral Satellite Imagery!
Learn advanced techniques in Land Use Land Cover (LULC) mapping with cutting-edge hyperspectral satellite imagery. This hands-on workshop will empower participants with the skills and tools required to preprocess, analyze, classify, and generate detailed LULC maps using open-source tools and Python-based frameworks.
Course Details:
Date: Jan 4-5 and 11-12, 2025
Time: 7:00 PM - 9:00 PM IST (Tentative) | Weekends Only
Duration: 8-10 hours of interactive live instruction + hands-on project work
Mode: Online, live classes via Zoom
Instructor: Mr. Rahul Koley – Passionate instructor from Industry with expertise in python for geospatial science.
Workshop Highlights
Hands-on training using Python and Google Colab for coding.
Exploration of real-world hyperspectral datasets like AVIRIS and Hyperion.
Building powerful classification models using Machine Learning (ML) and Deep Learning (DL) techniques.
LULC map generation and accuracy assessment using Python and QGIS.
Expert insights on real-world applications in agriculture, urban planning, and environmental monitoring.
What You’ll Learn
Introduction to Hyperspectral Imaging and LULC Mapping
Basics of hyperspectral imaging and its applications in LULC mapping.
Accessing and visualizing publicly available hyperspectral datasets.
Overview of LULC classification schemes (e.g., USGS Level I-IV).
Preprocessing Hyperspectral Data
Techniques for noise reduction, atmospheric correction, and dimensionality reduction.
Spectral signature analysis for identifying unique LULC class features.
Hands-on preprocessing using Python.
Building and Training Classification Models
Deep dive into Machine Learning (SVM, Random Forest) and Deep Learning (CNN).
Training CNN-based models for hyperspectral LULC classification using TensorFlow/Keras or PyTorch.
Hands-on implementation of classification models.
LULC Map Generation, Evaluation, and Applications
Generating LULC maps with QGIS and Python.
Assessing classification accuracy (Confusion Matrix, Kappa Coefficient, Overall Accuracy).
Applications of LULC mapping in real-world scenarios like agriculture and urban planning.
Tools and Technologies
Python: TensorFlow/Keras, PyTorch, NumPy, Matplotlib, Scikit-learn, GDAL.
QGIS: For map visualization and post-classification processing.
Public datasets: AVIRIS, Hyperion for hands-on analysis.
Who Should Attend?
This workshop is designed for individuals eager to explore the intersection of hyperspectral imagery and geospatial analysis. It is ideal for:
GIS and Remote Sensing Professionals:
Gain advanced expertise in hyperspectral data preprocessing, analysis, and classification.
Environmental Scientists and Planners:
Utilize hyperspectral LULC mapping for applications in agriculture, urban planning, and environmental monitoring.
Academicians and Researchers:
Leverage cutting-edge techniques in LULC mapping for innovative research and publications.
Data Science Enthusiasts:
Explore how Machine Learning (ML) and Deep Learning (DL) can be applied to geospatial datasets.
Students in Geography, Geoinformatics, or Earth Sciences:
Build foundational skills for a career in geospatial analysis using open-source tools.
Government and NGO Personnel:
Develop actionable insights for policy-making and environmental management.
Why Choose This Course?
Interactive Sessions: Each session includes live coding, Q&A, and real-world applications.
Certificate: Receive an e-certificate upon completing the workshop.
Practical Application: Apply the concepts through real-world datasets, ensuring you understand how to implement these statistical techniques in your work or research.
Expert Instructor: Mr. Rahul Koley, an expert in from industry, will guide you through the course, ensuring a deep understanding of each concept.
Recorded Sessions: Can’t make it to a live session? Don’t worry—recorded sessions will be available for review at your convenience.
Don't Miss Out! If you’re passionate about geospatial technology and want to master hyperspectral LULC mapping, this workshop is for you!
Registration Closes: Jan 2, 2025
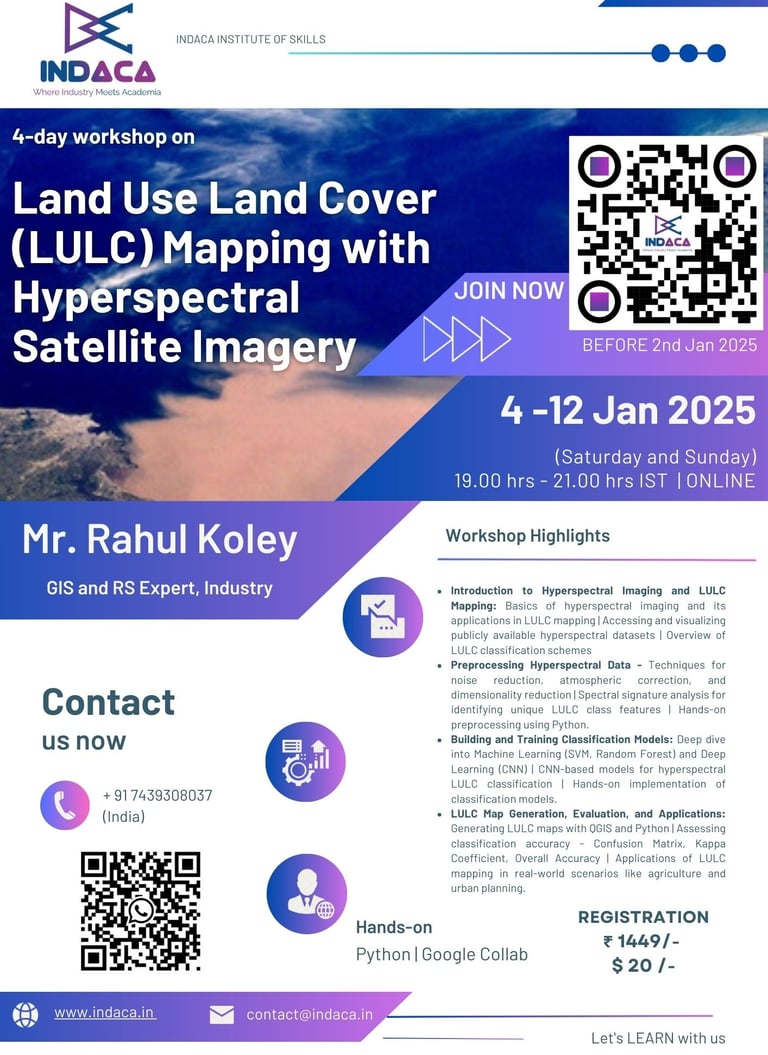
5 weeks Professional Development Program in Machine Learning and AI for Data Science!
Duration: 13th July 2024 - 11th August 2024 | Saturday and Sunday | 7:00 PM - 9:00 PM
Overwhelmed by Resources? We've Got You Covered!
Are you a researcher, data scientist, or professional overwhelmed by the countless resources available to learn Python? Unsure where to start or how to keep pace with the latest developments? We understand the struggle of navigating through thousands of tutorials, articles, and courses. Save your precious time and get the structured, comprehensive learning you need with Indaca Institute’s expertly designed program.
What You'll Gain:
Comprehensive Knowledge: Master Python programming, data preprocessing, feature engineering, and machine learning algorithms.
Practical Experience: Apply your skills through hands-on exercises and real-world projects.
Increased Efficiency: Save hours of data analysis time with streamlined techniques.
Career Advancement: Gain in-demand skills to accelerate your career in data science.
Problem-Solving: Learn to tackle complex data problems with advanced machine learning tools.
Certification: Receive a certificate to showcase your expertise.
Confidence: Build confidence in your data science abilities.
Community Support: Join a supportive learning community with access to resources and expert guidance.
📊 Course Highlights:
Week 1: Introduction to Machine Learning and AI: Define, scope, and apply in data science.
Week 2: Data Preprocessing and Feature Engineering: Clean data, transform, scale, select features, and reduce dimensions.
Week 3: Supervised Learning: Master regression and classification algorithms.
Week 4: Unsupervised Learning: Explore clustering and dimensionality reduction techniques.
Week 5: Advanced Topics and Final Project: Dive into neural networks, deep learning frameworks, and project guidance.
Mark your calendars from July 13th, 2024 to August 15th 2024, as the program kicks off with weekend sessions held on Saturdays and Sundays, totaling 20-22 hours of live classes and projects. Join us online via Zoom Meeting from 19:00 HRS to 21:00 HRS (IST) and unlock your potential in the world of data analytics.
🎓 Who can join?
Researchers and Data Scientists: Streamline your data analysis and enhance your research capabilities with efficient Python programming and machine learning techniques.
Professionals in Data-Driven Fields: Whether you work in finance, marketing, healthcare, or any other data-intensive industry, mastering Python for Data Science will significantly boost your productivity and problem-solving skills.
Students and Aspiring Data Scientists: If you're looking to break into the field of data science, this course provides a solid foundation and practical experience.
Professionals Looking to Pivot Careers: Transition smoothly into a data science role by gaining in-demand skills in Python and machine learning.
Anyone Overwhelmed by Online Resources: If you're lost in a sea of tutorials and articles, our structured, comprehensive course will provide clear guidance and a direct path to proficiency.
Benefits of Choosing INDACA:
No Prior Programming Knowledge Required: This course is designed for absolute beginners. We start from scratch and build your skills step-by-step.
Interactive Sessions: Participate in live, interactive sessions where you can ask questions and get immediate feedback.
Flexible Learning: Access course materials online and learn at your own pace. Our schedule is designed to fit into your busy life.
Certification: Earn a certificate upon completion of the course, showcasing your new skills to employers.
Community Support: Join a vibrant community of learners and professionals. Share your progress, ask questions, and collaborate on projects.
Resources and Materials: Gain access to a wealth of resources including articles, tutorials, and datasets.
Career Guidance: Receive personalized career advice and tips on how to leverage your new skills in the job market.
Special Discount on World Youth Skills Day 2024 - In honor of World Youth Skills Day 2024, we're offering a 50% discount! Unlock your potential and elevate your career with our comprehensive course, designed to make you a machine learning and AI expert.
Enrollment is now open, with registration closing on July 11, 2024. Secure your spot today and take the first step towards becoming a data analytics expert.
Don't miss this opportunity to gain in-demand skills at half the price! Enroll now and transform your future.
Sign Up Today!
For inquiries and enrollment, call or WhatsApp us at +91 7439308037.


1-month Professional Development Program on Remote Sensing of Environment with Open Source Software
📆 Program Schedule: Feb 10th, 2024 – March 11th, 2024 | 🗓️ Commencement: Feb 10th, 2024 | 🏁 Duration: 1 Month | Weekends | Saturday & Sunday - 20 – 22 hrs live classes + Projects | ⏰ Time: 19:00 HRS (IST) – 21:00 HRS (IST) | 📍 Location: Online (Google Meet)
Hands-on - QGIS | SAGA GIS | Whitebox Tools | Open-Source Plugins | Cloud Computing | Google Earth Engine
Week 1: Fundamentals of Remote Sensing for Environmental Monitoring | Feb 10-11, 2024 - 👩🏫 Instructor: Dr. Gouri Sankar Bhunia, Industry Expert in GIS and Remote Sensing - Introduction to Remote Sensing | Satellite Data Collection Sources and Techniques | Digital Image Processing | Data Conversion | Band Composition, Mosaicking, and Raster Calculation | Spectral Transformation and Land Use Land Cover Classification | Change Detection in LULC
Week 2: DEM and Its Application in Watershed Modeling | Feb 17-18, 2024 - 👩🏫 Instructor: Dr. Priyank P Patel, Faculty at Presidency University - Basics and Importance of DEM in Geospatial Analysis | Geoprocessing Tools for DEM-based Analysis | Terrain Analysis, Watershed Delineation, and 3D Visualization Watershed Modeling Enhancements and Rainfall-Runoff and Inundation Modeling
Week 3: Forest Resource Management, Agriculture & Crop Health | Feb 24-25, 2024 - 👩🏫 Instructor: Dr. Gouri Sankar Bhunia, Industry Expert in GIS and Remote Sensing - Remote Sensing Technologies for Forestry and Agriculture | Sensor Selection Criteria | QGIS Setup for Forestry and Agriculture | Basic Preprocessing Steps and Techniques for Mapping | Forest Change Detection and Crop Monitoring |Integration of Remote Sensing Data for Precision Agriculture
Week 4: LULC Change and Urbanization Modeling with Cloud Computing | March 2-3, 2024 - 👩🏫 Instructor: Dr. ir. Sk. Mustak, Faculty at Central University of Punjab Introduction to LULC Change and Urbanization Modeling | Google Earth Engine Setup and Dataset Visualization | Change Detection Algorithms and Uncertainty Analysis | Post-Processing of LULC in Cloud Computing | Integration of LULC Change Data for Urbanization Modeling | Urban Growth Patterns Analysis using Google Earth Engine
Week 5: Remote Sensing of Soil Erosion | March 9-10, 2024 - 👩🏫 Instructor: Dr. Kapil Ghosh, Diamond Harbour Women University - Introduction to the Universal Soil Loss Equation (USLE) model and its components | Introduction to USLE factors: Rainfall, Soil Erodibility, Slope Length, Slope Steepness, and Land Cover Management | Advanced remote sensing technologies (LiDAR, SAR, etc.) | Integration of multiple data sources for soil erosion assessment | Importing relevant datasets for USLE factors into QGIS | Applying the USLE model using QGIS tools | Analyzing and visualizing soil erosion risk using the USLE approach
🌐 Program Benefits with Indaca Institute of Skills
Comprehensive curriculum for maximum learning in a short time.
Lifetime access to session recordings for practice.
Extensive hands-on practice with open-source remote sensing software for practical proficiency.
3-month post-workshop support and personal guidance.
Professional development certificate upon program completion.
🎓 Enroll Today and Unleash the Power of Remote Sensing for Environmental Monitoring!
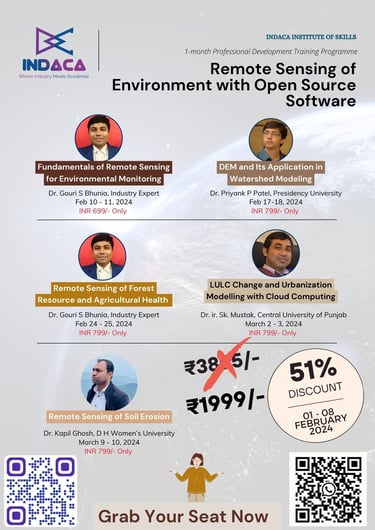
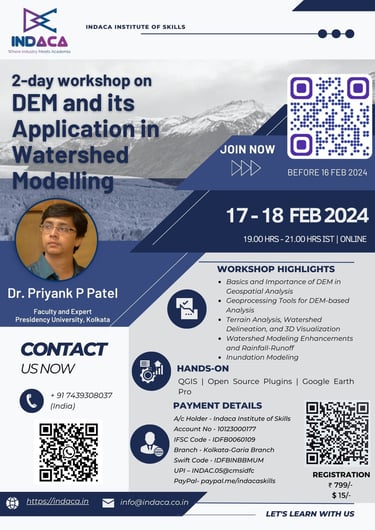
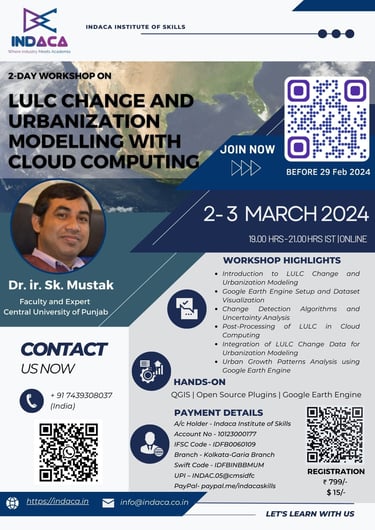
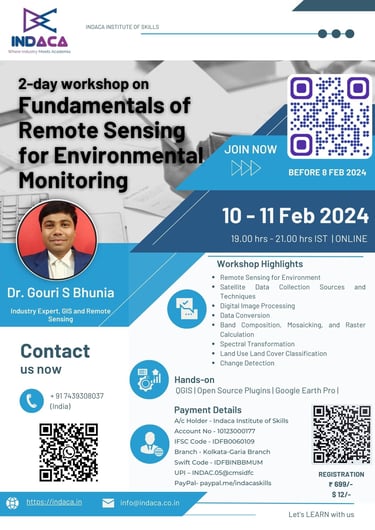
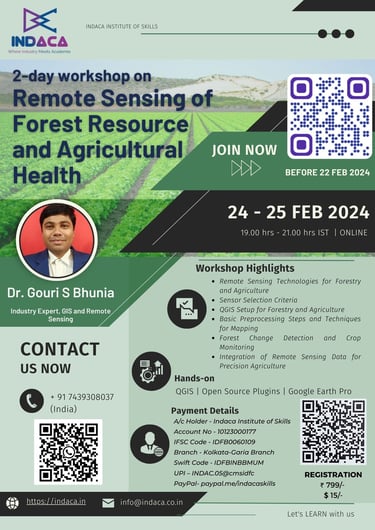
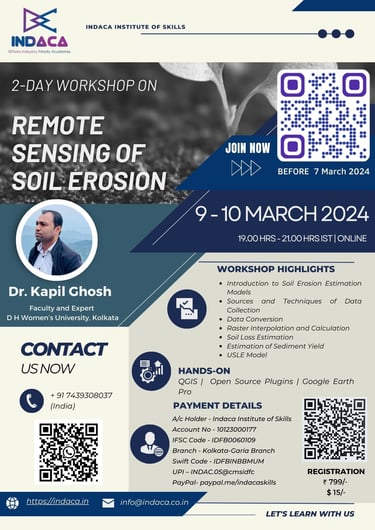
contact@indaca.in
Socials
Subscribe to our newsletter
Copyright © 2025 Indaca Institute of Skills, All rights are reserved
WhatsApp: (+91) 9038413517
Call: (+91) 7439308037